31 Advertising Statistics to Know in 2018

The marketing industry is constantly changing, and that’s particularly true of digital channels.

And while keeping up with new trends can be challenging, it’s more than worth the effort. Staying on top of what’s happening in the industry is the best way to keep up with your competitors and identify new strategies that will move you closer to your marketing goals.

With that in mind, we’ve compiled a list of 31 of the most important advertising statistics you should know to succeed in 2018.

Keep reading for the up-to-date information you need on PPC advertising, social media, mobile advertising, email marketing, video advertising, and what’s on the horizon for the marketing industry.

PPC Advertising Statistics

1. Google and Facebook still hold the largest share of total US digital ad spend, with 38.6% and 19.9%, respectively.

It should come as no surprise to experienced digital marketers that the majority of online advertising dollars go to Google and Facebook.

 31 Advertising Statistics to Know in 2018

(Image Source)

That said, both of their shares are expected to decrease slightly over the next few years as advertising options on other platforms like Amazon and Snapchat increase in popularity.

2. Businesses make an average of $2 in revenue for every $1 they spend on Google Ads.

If you’re unsure of whether Google Ads (formerly known as Google AdWords) has the potential to generate revenue for your business, you’ll be glad to hear that businesses typically make double their investment on the platform.

And if you’re already running Google Ads campaigns, but not seeing these kinds of results, this could be a sign that your strategy is in need of some adjustments.

3. The average click-through rate (CTR) in Google Ads across all industries is 3.17% for the search network and 0.46% on the display network.

Measuring your success on any advertising platform can be challenging without concrete benchmarks, which is why it can be helpful to know the average CTR of other marketers’ campaigns.

 31 Advertising Statistics to Know in 2018

It’s also worth noting that the average conversion rate for Google Ads clicks is 3.75% for search and 0.77% for display.

4. The average cost per click (CPC) in Google Ads across all industries is $2.69 on the search network and $0.63 on the display network.

Another metric to keep an eye on with any PPC campaign is the cost per click or CPC.

 31 Advertising Statistics to Know in 2018

Within the Google Ads platform, the average CPC is over $2 higher for ads in the search results than for those run on the display network.

5. Omnichannel strategies drive an 80% higher rate of incremental store visits for local businesses.

Omnichannel advertising strategies like showing what’s in stock at nearby stores and increasing bids around business locations have become increasingly popular over the past few years.

And as this statistic demonstrates, they’re effective for generating incremental visits, or visits that businesses wouldn’t have received otherwise.

Social Media Statistics

6. Social media platforms capture 33% of the time users spend online.

Effective digital marketing requires reaching your audience where they already spend time online.

 31 Advertising Statistics to Know in 2018

(Image Source)

And considering that today’s internet users spend a third of their time on social media, this is a channel most businesses can benefit from including in their strategies.

7. 4 in 10 internet users say they follow their favorite brands on social media.

Considering that 40% of internet users follow brands on social media, these platforms are natural choices for boosting customer loyalty.

Beyond that, 1 in 4 internet users also follow brands from which they’re considering making a purchase — meaning that even if they aren’t customers yet, the content you share with your followers could be the determining factor in whether they convert.

8. 37% of online shoppers say they use social media for “purchase inspiration.”

Over one-third of online shoppers use social media to “find inspiration” for a purchase.

 31 Advertising Statistics to Know in 2018

(Image Source)

This is higher than any other form of online media, including retailer websites, price comparison websites, and multi-brand websites.

9. 96% of B2C marketers say that Facebook is a valuable marketing platform.

Facebook is still the platform of choice for the majority of B2C marketers.

 31 Advertising Statistics to Know in 2018

(Image Source)

Among B2B marketers, though, LinkedIn has a slight edge, with 93% claiming it as the most valuable platform for their business.

10. The average session duration on Reddit is 4.83 minutes.

Although many advertisers overlook Reddit, its users spend more time per visit than users on Facebook (4.81 minutes), Instagram (3.05 minutes), Twitter (2.76 minutes), and Snapchat (1.79 minutes).

And while successfully marketing on the platform requires a strong understanding of its audience, it’s certainly possible — as illustrated by Findlay Hats, which made $28,000 in sales from one post.

Mobile Advertising Statistics

11. 69% of digital media time is spent on mobile devices.

Mobile advertising has become increasingly important over the past few years.

And considering that internet users now spend over two-thirds of their digital media time on smartphones and other devices, it’s unlikely that it’s going to slow down anytime soon.

12. The average mobile PPC ad click-through rate (CTR) drops 45% between positions one and two.

It’s not news to say that the higher a result or ad is on a results page, the higher its average CTR — but a 45% drop between the first and second ads is significant.

 31 Advertising Statistics to Know in 2018

(Image Source)

This is much more dramatic than the drop on desktop computers and tablets, and important to keep in mind if you’re optimizing campaigns for mobile devices.

13. Appearing in mobile search ad results can increase brand awareness by 46%.

Making your target audience aware of your brand is an essential step in the sales process and one that mobile search ads can help with.

 31 Advertising Statistics to Know in 2018

(Image Source)

In fact, 51% of smartphone users have discovered a new company or product when searching on their smartphones.

14. 82% of smartphone users consult their phones while in a store.

Mobile devices are becoming increasingly integrated into consumers’ daily lives.

Shoppers now not only use them to find stores in which they can make a purchase but also to continue researching their options once they’ve arrived at a store.

15. 84% of consumers between the ages of 18 and 29 are most likely to use a mobile device when shopping online.

Young online shoppers now overwhelmingly prefer to browse and make a purchase on mobile devices rather than desktop computers.

Consumers in the 18 to 29 age bracket lead this trend but are closely followed by 78% of consumers in the 30 to 44 group.

Email Marketing Statistics

16. Traffic from email marketing campaigns has an average conversion rate of 4.29%.

Although it’s now one of the oldest forms of digital marketing, email still boasts an impressive conversion rate.

 31 Advertising Statistics to Know in 2018

(Image Source)

This is higher than the averages for traffic from search, direct, and social media.

17. Gmail ads with an open rate around 2% have a CPC of roughly $1. That drops to less than 20 cents for ads with an open rate above 25%.

Gmail ads are still a relatively new option, and some marketers struggle to gauge their success due to the lack of a Quality Score metric.

But as the statistic above demonstrates, it’s clear that the higher your open rates, the less you’ll pay for each click — so if you’re looking to improve your campaigns on the platform, you’ll need to improve your audience targeting and optimize your subject lines for clicks.

18. Revenue from email campaigns made up an average of 21% of companies’ overall revenue, up from 17% in 2016.

Even as more new channels develop, revenue from email campaigns continues to make up a significant portion of digital marketing revenue.

 31 Advertising Statistics to Know in 2018

(Image Source)

That proportion increased from 2016 to 2017, illustrating that the channel isn’t at risk of losing value to the newer options available to marketers.

19. 65% of marketers believe that dynamic content in email marketing is effective.

When asked to rate the effectiveness of personalization tactics, marketers indicated that dynamic content was the best for their businesses.

 31 Advertising Statistics to Know in 2018

(Image Source)

In the same survey, 60% of marketers said personalized email content based on real-time data is effective, and 58% said the same of personalized email content based on software and machine learning.

20. Open rates are 14.31% higher in segmented campaigns than in non-segmented campaigns.

Segmentation is a popular tactic among email marketers, and for good reason.

A study by MailChimp found that segmented campaigns achieve higher open rates, more clicks, lower unsubscription rates, and fewer bounces.

21. 73% of email marketers are prioritizing optimizing email for mobile devices.

Given the importance of catering to mobile users, it makes sense that the majority of email marketers are now making this their top priority for improving campaigns.

Video Advertising Statistics

22. 64% of consumers say that watching a video on Facebook influenced them to make a purchase.

When marketers first incorporated video into their strategies, it was largely seen as a way to drive engagement.

And while it can certainly be effective for this goal, it also shows clear potential to drive sales and other high-impact conversions.

23. US companies spent $13.23 billion on digital video ads in 2017.

Video has quickly grown in popularity, with US companies spending over $13 billion on video ads in 2017 — and that number is predicted to increase to over $22 billion by 2021.

24. Video ad completion rates have steadily increased over the past few years, reaching 70% overall in 2017.

As marketers gain more experience with video, they’ve also become more successful in creating videos that retain viewers’ attention.

 31 Advertising Statistics to Know in 2018

(Image Source)

As of 2017, overall completion rates were up to 70% — a drastic improvement from the 47% average just two years prior.

25. The average video CTR increased slightly in 2017, up to 0.45% from 0.35% in 2016.

As consumers become more familiar with video, more of them are clicking to learn more about the content they see.

 31 Advertising Statistics to Know in 2018

The biggest jump in video CTR was among desktop users, while CTR on tablets slightly decreased.

Consumer Advertising Preferences

26. 73% of consumers dislike pop-up ads.

As an internet user, you’re likely among the majority that dislikes pop-up ads.

In fact, 81% of consumers have closed a browser or exited a webpage because of one — meaning that if you use them as part of your advertising strategy, it’s essential to be cautious of damaging the browsing experience.

27. 72% of consumers want brands to share discounts and sales on social media.

When asked what they want the brands they follow to post on social media, the majority of consumers said discounts or sales.

Unfortunately, only 18% of marketers post these on a regular basis, meaning there’s a disconnect between what consumers want and what brands are delivering.

 31 Advertising Statistics to Know in 2018

(Image Source)

On the flip side, 58% of marketers say they share posts that “tell a story” — but only 37% of consumers want this kind of content.

28. 86% of consumers would like to receive promotional emails “at least monthly.”

Frequency is a difficult element to get right with email marketing. The majority of consumers want to receive promotions at least once per month, but only 15% would like to receive them every day.

The Future of Advertising

29. Amazon’s US ad revenues are projected to climb 63.5% in 2018, surpassing $2 billion for the first time

Although Google and Facebook are on track to remain the largest two advertising platforms, Amazon is expected to experience significant growth this year and become the third-largest.

30. 57% of marketers believe that influencer marketing will be integrated into all marketing activities in three years.

Influencer marketing has steadily grown in popularity over the past few years, and that growth is expected to continue over the next three years.

 31 Advertising Statistics to Know in 2018

(Image Source)

In one survey, 57% of marketers said that influencer marketing will be integrated in all marketing activities, and 47% expect it to become a cross-functional discipline that will expand beyond marketing.

31. Global spending on augmented reality (AR) advertising reached almost $13 billion in 2017.

While many marketers focused their attention on the potential uses of virtual reality (VR) over the past few years, that attention has now shifted to augmented reality (AR).

 31 Advertising Statistics to Know in 2018

(Image Source)

Overall spending on AR nearly doubled in 2017, and that number is predicted to continue increasing.

And considering that AR company Blippar claims that brands have seen 30% higher engagement rates with their advertisements, it’s no wonder that many are shifting their focus toward augmented reality as the next big trend in digital marketing.

Conclusion

The digital advertising industry now changes so rapidly that it can be challenging to keep up, but the statistics above should give you a solid idea of what’s happening with the most important channels.

Still, there’s a constant flow of new data available — so let me know if there’s anything important I missed in the comments below!

 31 Advertising Statistics to Know in 2018

Brad Smith

Brad Smith is a marketing writer and partner at Codeless Interactive, LLC.

share save 171 16 31 Advertising Statistics to Know in 2018
Posted in Adwords | Tagged | Comments Off on 31 Advertising Statistics to Know in 2018

5 Ways Lead Gen Marketers Can Use Facebook’s New Feature to Spy on Competition


Last week, Facebook shipped a new feature which allows anyone to see the ads any business is running on the platform. This is designed to bring more transparency to ads and Pages on Facebook — a timely move ahead of the general election in Brazil this upcoming October.

For advertisers, this new feature offers tons of valuable data for marketing intelligence. Because anyone can see the ads a Page runs across all of the Facebook-owned properties, including Instagram and the partner network, marketers can learn from their competitors’ ads even if those ads aren’t shown to them.

Here’s how to do it:

  1. Log into Facebook
  2. Go your competitor’s Page
  3. Select “Info and Ads.”

 5 Ways Lead Gen Marketers Can Use Facebook’s New Feature to Spy on Competition

From this screen, you can see the ads a company runs, and which creatives they use for different countries. For example, Warby Parker runs non-localized ads in 25 countries.

 5 Ways Lead Gen Marketers Can Use Facebook’s New Feature to Spy on Competition

Here’re some examples of ads you can view from Warby Parker’s “Info and Ads” page.

 5 Ways Lead Gen Marketers Can Use Facebook’s New Feature to Spy on Competition

Warby Parker’s app install ad with a call to action to renew your glasses prescription

 5 Ways Lead Gen Marketers Can Use Facebook’s New Feature to Spy on Competition

Warby Parker’s seasonal ad featuring its Summer 2018 collection

 5 Ways Lead Gen Marketers Can Use Facebook’s New Feature to Spy on Competition

A personalized Facebook ad featuring the items a person has been browsing on the Warby Parker’s website

Armed with this knowledge, you can analyze your competition, and fine-tune your PPC strategy to create better, more engaging ads. Here’re five ways to use competitive intelligence to your advantage:

1. Track your competitors’ new product features and messaging

Often, companies use Facebook ads to gauge people’s interest in a new product or feature, and test it on a smaller audience before releasing to the larger market.

segment.png?t=1531341867511&width=499&name=segment 5 Ways Lead Gen Marketers Can Use Facebook’s New Feature to Spy on Competition

2. Get ideas for new content

It’s a common marketing practice to put paid traffic towards the best content that already performs well organically. Using the new transparency feature, you can see which content your competitors are promoting the most.

pipedrive.png?t=1531341867511&width=506&name=pipedrive 5 Ways Lead Gen Marketers Can Use Facebook’s New Feature to Spy on Competition

3. Check new offers and sales

Among other ads your competition is running, you can see the deals and discounts they’ll be offering for a limited time, such as during seasonal promotions.

blueapron.png?t=1531341867511&width=504&name=blueapron 5 Ways Lead Gen Marketers Can Use Facebook’s New Feature to Spy on Competition
4. Monitor pricing

Monitoring your competitors’ changes in pricing can help you optimize your strategy and identify opportunities for differentiation.

stitchfix.png?t=1531341867511&width=500&name=stitchfix 5 Ways Lead Gen Marketers Can Use Facebook’s New Feature to Spy on Competition

5. Get inspired by great Facebook ad examples

Competition often pushes us to be our best, which is also true for advertising creative. If you’re looking for inspiration to create better Facebook ads, look no further than your competition, and copy their successful tactics.

 5 Ways Lead Gen Marketers Can Use Facebook’s New Feature to Spy on Competition

Use the new Facebook transparency feature to learn from competition

The recent Facebook’s feature aimed at bringing more transparency to political ads is a great resource for marketers in all industries. Using the new “Info and Ads” tab on your competitors’ page, you can learn and copy others’ advertising techniques and tactics, whether it’s pricing, messaging, or ad creative.

share save 171 16 5 Ways Lead Gen Marketers Can Use Facebook’s New Feature to Spy on Competition
Posted in Facebook | Tagged | Comments Off on 5 Ways Lead Gen Marketers Can Use Facebook’s New Feature to Spy on Competition

Chrome Plugins for Marketers in 2018

Chrome is one of the most used browsers online. Aggressive campaigns from Google helped Google Chrome to expand rapidly and increase its user base steadily. Chrome is also one of the most used Browsers among Marketers, and this is mostly because of the cool little tools many companies offer for Chrome. These little tools which give your Browser additional functionalities in Chrome are called Plugins or Extensions, and you can install them from the Extension Directory to add additional functions to your browser.
Plugins are fantastic but they need to work, and we need to make sure that the information shared with the plugin does not include any private stuff. Be aware that

companies develop plugins which connect to your browser. Always be mindful of what you activate, when you use it and which information you are about to type into your browser.

There are many different Plugins or Extensions for Marketers, and today I wanted to resume the best Chrome Plugins for Marketers in 2018 that I am continually using during my daily work but also some new interesting ones we found during the research for this article.

Analytics / Marketing

Social Media Management

CRM and Contacts

Writing and Content

eCommerce Chrome Plugins

SEO Chrome Plugins

Meetings

Resources PC/Mac

Security

This is an ongoing list and we will keep adding cool plugins constantly, so make sure to check back in later.

Do you know any Extension or Plug-in that should be on this list? Let us know in the comments!

Are you a Chrome Plugin or Extension developer and want us to test your plugin? Send us an email and we’ll be happy to give it a spin!

share save 171 16 Chrome Plugins for Marketers in 2018
Posted in SEO | Tagged | Comments Off on Chrome Plugins for Marketers in 2018

Google Cloud Spanner connector

Connect Data Studio to Cloud Spanner databases.

Google Cloud Spanner is an enterprise-grade, globally-distributed, and strongly consistent database service built for the cloud specifically to combine the benefits of relational database structure with non-relational horizontal scale.

The Cloud Spanner connector allows you to access data from Cloud Spanner within Data Studio.

Cloud Spanner is a paid service. Learn more about pricing.

In this article:

How to connect to Google Cloud Spanner

A Data Studio data source can connect to Cloud Spanner using SQL.

To connect
  1. Sign in to Data Studio. After signing in, you’ll see the Home page, with the REPORTS tool selected.
  2. On the left, navigate to the DATA SOURCES Home page.
  3. In the bottom right, click  Google Cloud Spanner connector.
  4. Select the Cloud Spanner connector.
  5. Configure access to your database (see below).
  6. Type your SQL query.
  7. In the upper right, click CONNECT.
    1. The data source fields panel appears.
    2. The data source is now connected to your data set.

You can now access all of the fields in the SQL query as fields in your reports.

Connection options

Connecting to Cloud Spanner requires the following connection information:

  • Project ID
  • Instance ID
  • Database ID
List instance configurations

The gcloud command-line tool enables you to interact with Cloud Spanner. You use the gcloud spanner command to interact with Cloud Spanner.

To see the set of instance configurations that are available for your project:

gcloud spanner instance-configs list

You should see a list of regional and multi-region configurations.

Regional configurations distribute data in a single region, while multi-region configurations distribute data geographically across multiple regions. Read more about these in Instances.

Special data types

Data Studio maps your table’s column data types to a unified set of Data Studio types. Some database types are currently not supported in Data Studio. When Data Studio encounters a column of a non-supported type, it will not create a field for that column.

Limits of the Cloud Spanner connector

The response size from Cloud Spanner is limited to 10 MB. See the Cloud Spanner Limits article for other limits.

share save 171 16 Google Cloud Spanner connector
Posted in Data Studio | Tagged | Comments Off on Google Cloud Spanner connector

How to build a Google Data Studio Dashboard

Google Data Studio allows you to build beautiful custom dashboards for a variety of data and analytics. In the past, dashboards were accomplished by using Google Analytics’ built-in dashboards as well as prebuilt dashboards & reports within other mar-tech products. This had consumers jumping from product to product to find out their KPI’s.

Google Data Studio makes it easy for anyone to create custom dashboards that pull from multiple sources. You can pull in data from Google Analytics, Google Adwords, Google Search Console and even from other products such as Bing Ads, Facebook Ads, LinkedIn, Twitter and more. These are known as connectors

Simple Steps To Build Your First Google Data Studio Dashboard

For this tutorial, we are going to build a simple Website Overview and SEO Google Data Studio dashboard. For this dashboard, we will be using two Data Studio connectors, Google Analytics & Google Search Console.

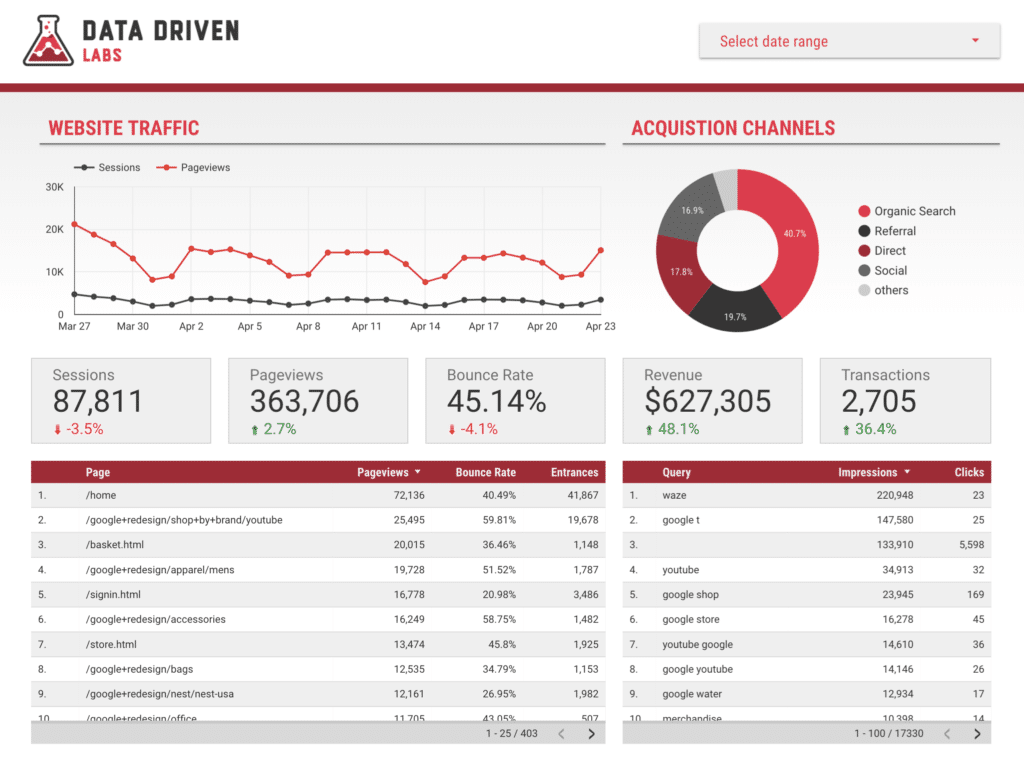
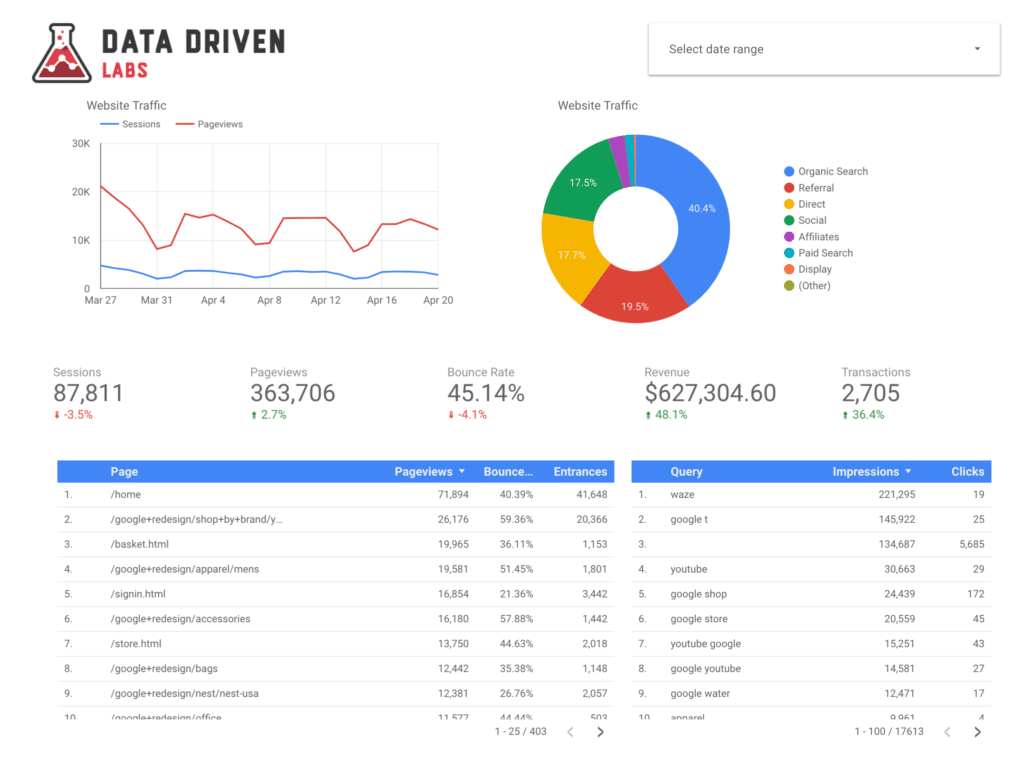
This tutorial will be broken out into 7 simple steps to create a Google Data Studio dashboard such as this one below.

after 1024x766 How to build a Google Data Studio DashboardOur example Google Data Studio dashboard

Step 1: Login & Create A Blank Report

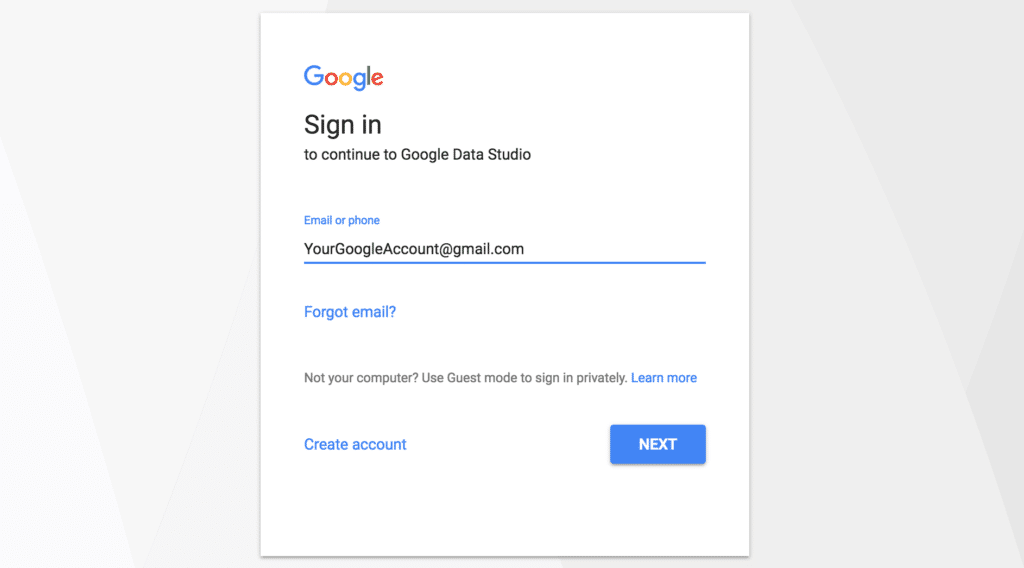
The first step is to visit datastudio.google.com and sign in with the account that is the same account as the Google Analytics & Google Search Console you want to create the dashboard for.

sign in data studio 1024x568 How to build a Google Data Studio DashboardSign in to Google Data Studio with your Google Analytics account

Once you have signed in and accepted any Terms of Service notices, we are now ready to create our blank report. Simply click on “+” for the “Blank” report template. There are other pre-built templates you can check out, however, for this tutorial, we are going to create a new blank report.

data studio blank report 1024x301 How to build a Google Data Studio DashboardCreate a blank dashboard

Finally, let’s rename this dashboard so it is easy to find. This is an important step. Google will auto-save your dashboard as you go, however, if you leave the name as the default, it will be difficult to find later.

rename report 1024x237 How to build a Google Data Studio DashboardRename your dashboard

Step 2: Add Your First Data Source

For this dashboard, we will need two data sources. We will need to connect to Google Analytics & Google Search Console.

First, click the “Create New Data Source” button. 

create new data source button 1024x242 How to build a Google Data Studio DashboardClick Create New Data Source

Next, find the Google Analytics connector and select Google Analytics. You will notice there are many other connectors you can choose from. These are all the different data sources that can be pulled into a report. For now, let’s stick to our current dashboard.

select google analytics connector 1024x340 How to build a Google Data Studio DashboardFind and select the Google Analytics connector

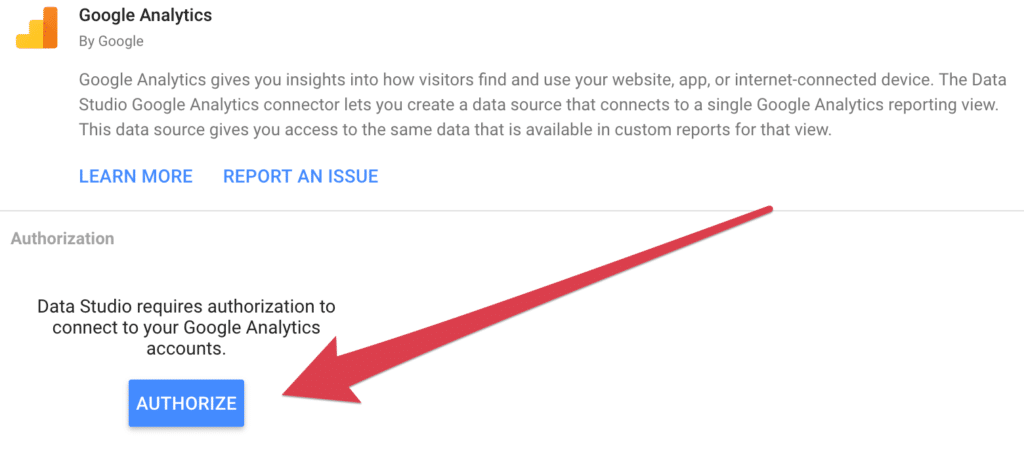
We now need to authorize our connection to Google Analytics. You will need to select “Allow Access” on the authorization popup that follows. 

authorize ga connector 1024x457 How to build a Google Data Studio DashboardAuthorize the Google Analytics connector

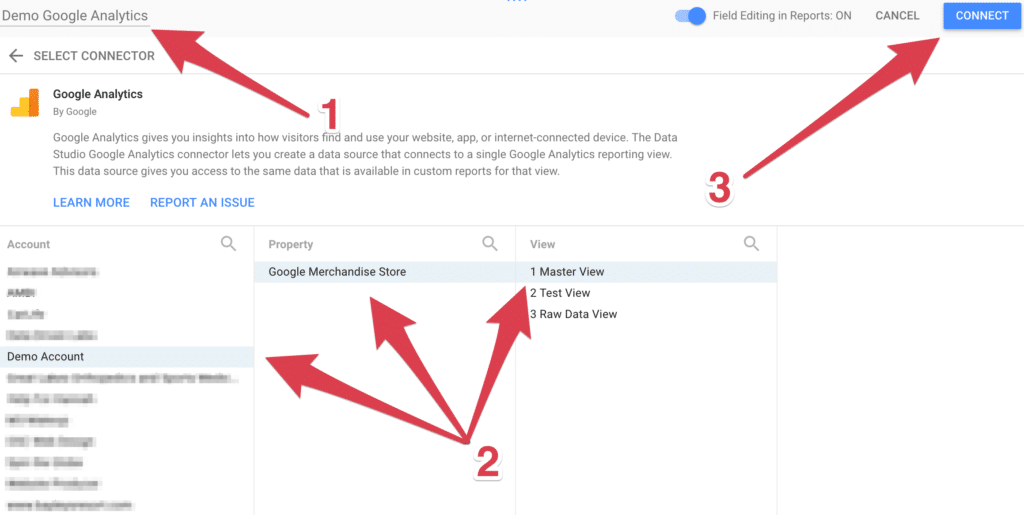
Our next step is to rename this connector to make it easier to find. In this example, “Demo Google Analytics” is being used. (See #1)

Now we must choose our Google Analytics account, then the property followed by the view. This should be your main view that you use when viewing your data in Google Analytics. (See #2)

To finish this step, click the connect button to connect to this data source. (See #3)

adding ga data connector 1024x515 How to build a Google Data Studio DashboardRename, select account/property/view, and connect

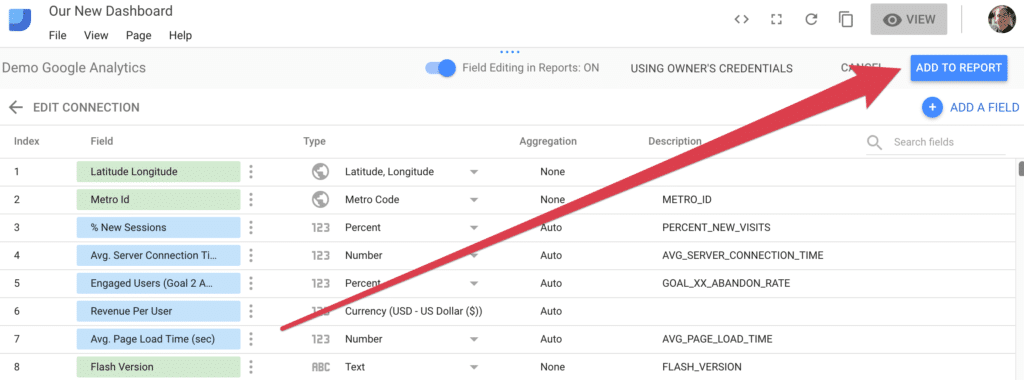
The final stage to adding the data source is to click “Add to Report”. At this state, you are able to modify fields and add calculated fields if needed. This is more advanced and will be covered in a later article. For now, all the fields are setup perfectly fine for our dashboard.

add to report ga 1024x380 How to build a Google Data Studio DashboardClick “Add to Report”

Step 3: Add Your Second Data Source

Now that we have already added one data source, the screen has changed and we no longer have the “Create Data Source” button in the lower right of the screen. To add a second data source, we will need to go to “Resource” and select “Manage added data sources”.

add second data source 1024x236 How to build a Google Data Studio DashboardUnder “Resource” select “Manage added data sources”

This is the panel where you can manage your data sources for each report/dashboard. You will see our first data source we added. To add a second, just click on “Add A Data Source”.

click add data source 1024x164 How to build a Google Data Studio DashboardClick “Add A Data Source”

This will take you back to the connector gallery. Simply find the “Search Console” connector and select it. You may need to authorize once again. 

search console connector 1024x341 How to build a Google Data Studio DashboardSelect “Search Console”

As we did before, rename this data source to something you can identify easily later. (See #1)

Next, select your site and for this dashboard we are going to focus on “Site Impression” table.

Finally, click the connect button to connect this to your dashboard.

Pasted Image 4 21 18  2 23 AM 1024x315 How to build a Google Data Studio DashboardRename, select site and table, connect to your dashboard

Step 4: Adding Elements

Now that we have setup all our data sources, it’s time to build out our dashboard. Google Data Studio comes with several types of elements that can be added to your report. These elements include line graphs, pie charts, tables, geo maps, scorecards and many more. 

elements 1024x240 How to build a Google Data Studio DashboardElements you can add to your dashboard

Line Graphs / Time Series

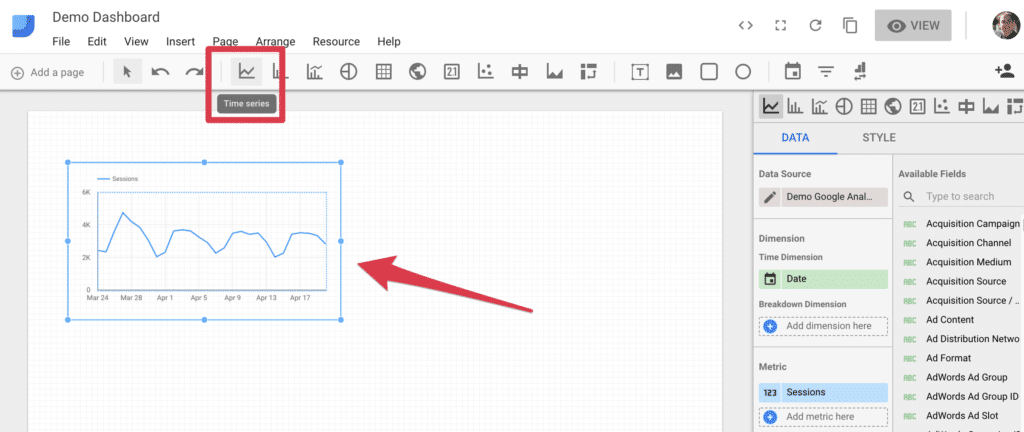
Our first element we want to add to our dashboard is a time series line graph. This will allow us to visualize our traffic over time. To do this, simply click on the time series element from the menu and drag out a graph to take up the top left half of our dashboard. 

add time series 1024x432 How to build a Google Data Studio DashboardAdd a time series graph

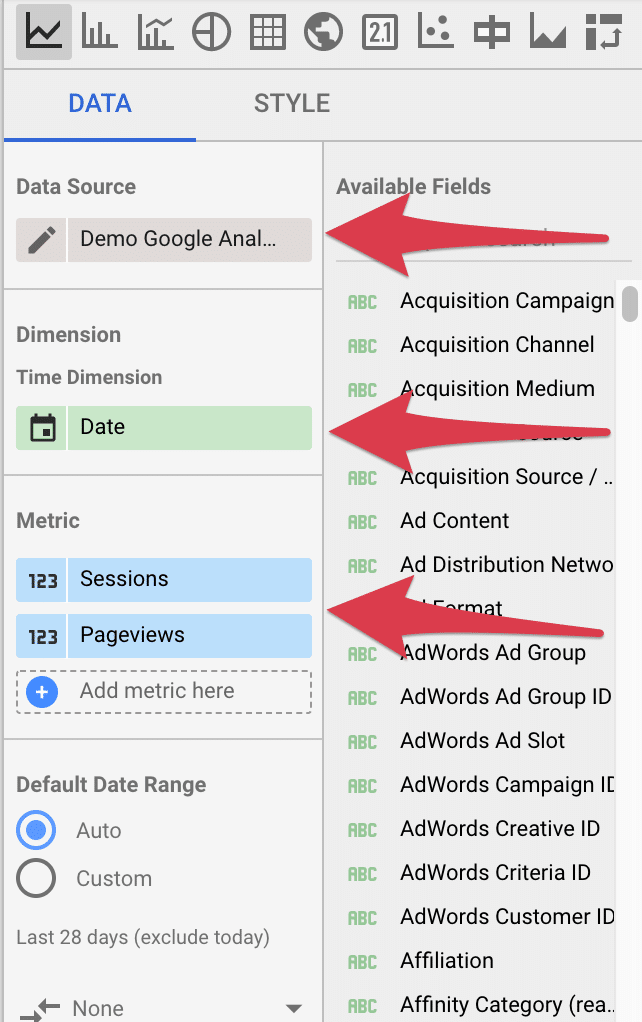
Once you add this graph, we need to select our data source, dimensions and metrics. 

First, we will want to select the correct data source. Because the last data source we added was search console, your graph may default to that data source. To change this simply select the edit button next to the data source in the panel to the right of your dashboard. Pick the data source that you set to Google Analytics in step 3. 

For our time dimension, we will want to break this out by date. There are many options you can choose from, feel free to browse other options. For this example dashboard we will use “Date”. 

With this type of graph, you can have multiple metrics which will show up as different colored lines on the line graph. For this example, we want to pick “Sessions” and “Pageviews”. 

As you pick these dimensions, pay attention to the line graph in your dashboard. Your graph will update to reflect your changes immediately. 

set dimension metrics How to build a Google Data Studio DashboardUpdate your data source, dimension and metrics

Pie Charts

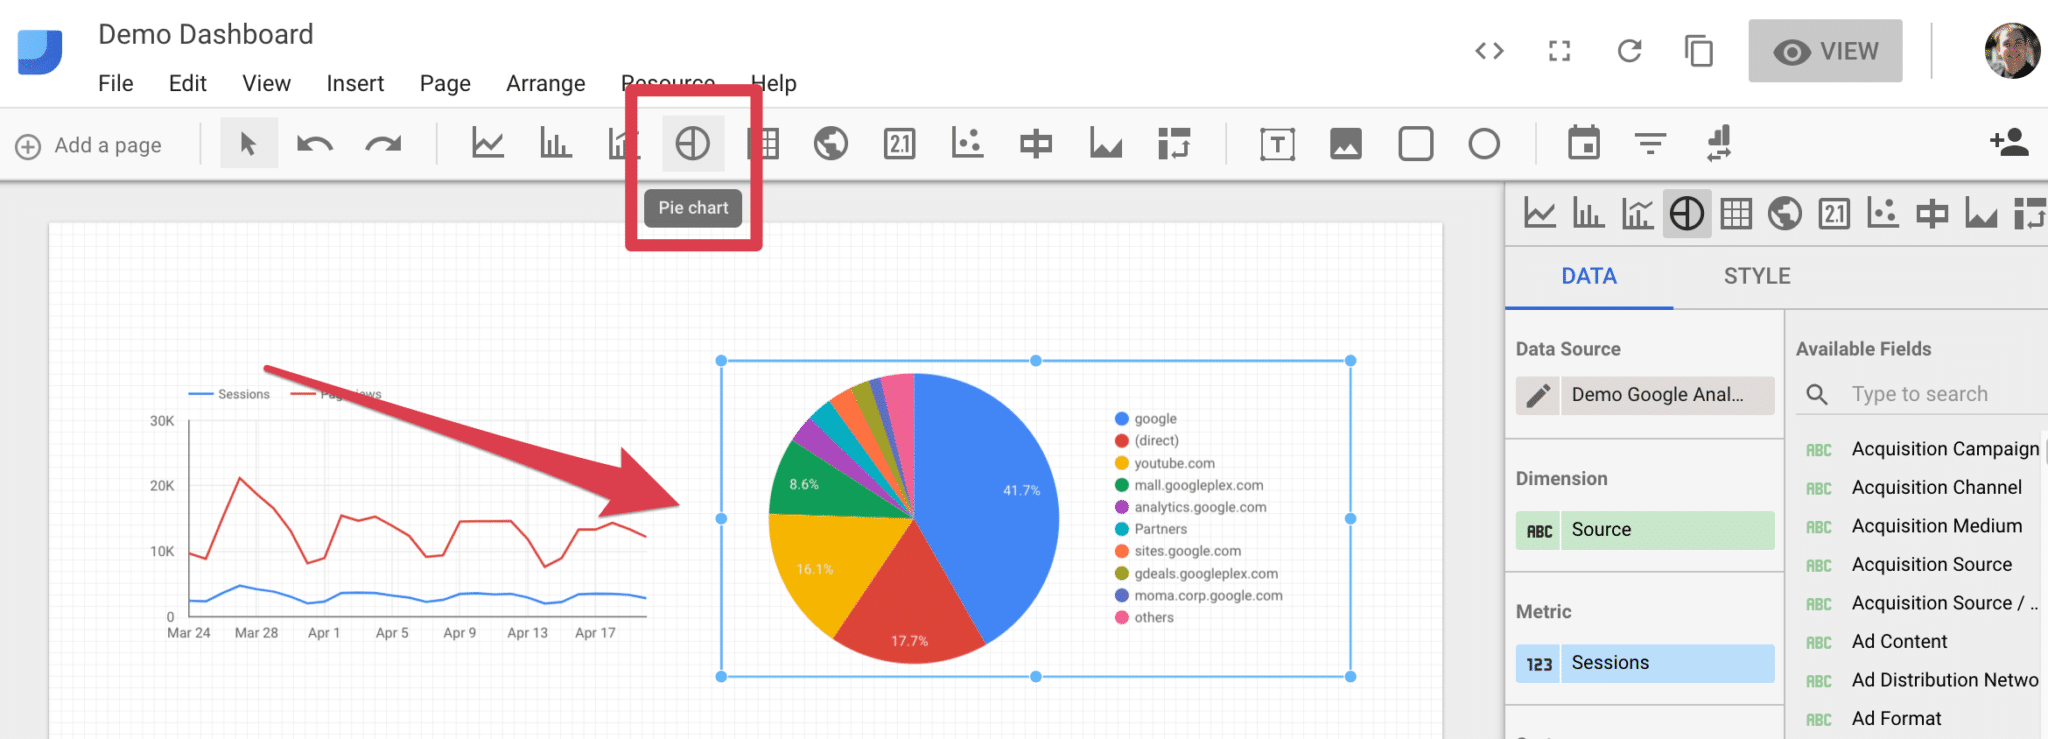
Next, lets create a pie chart to visualize our acquisition channels. Select the pie chart element from the menu and add it into the blank space next to our line graph we added previously. 

add pie chart How to build a Google Data Studio DashboardAdd a pie chart

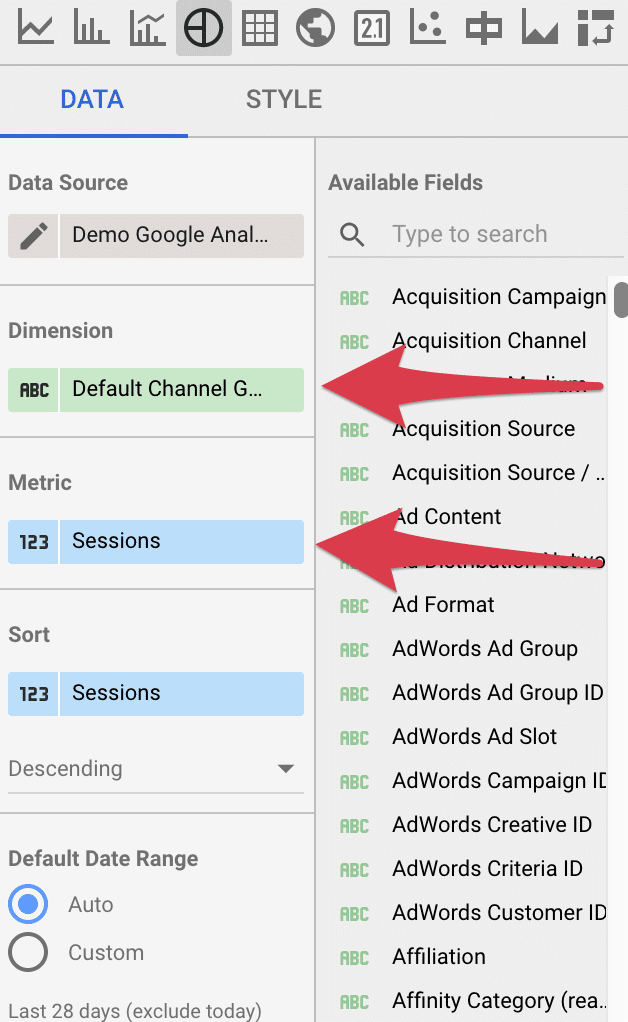
When you add your pie chart, it will pull in default dimensions and metrics. We will want to update these to reflect our acquisition channels. Simply change the dimension to “Default Channel Grouping” and your metric to “Sessions”.

channel dimension set How to build a Google Data Studio DashboardUpdate your data source, dimension and metrics

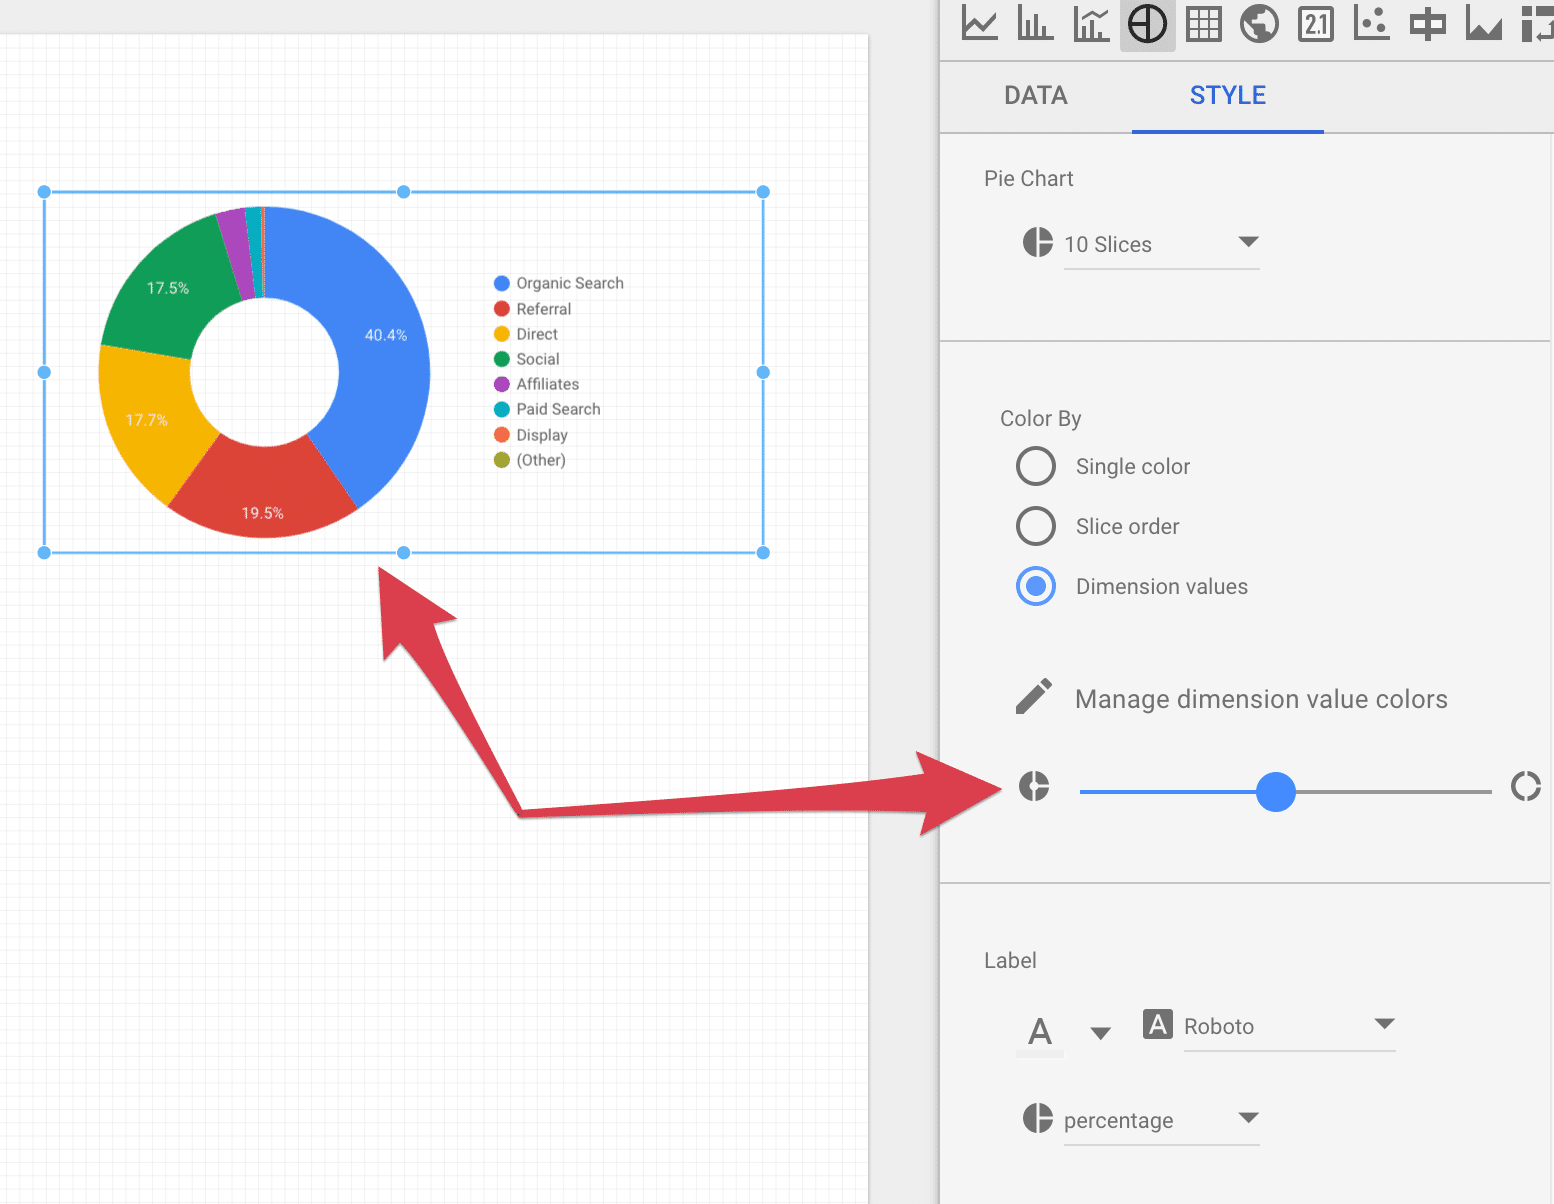
You can also play with the styles for any element you add to the dashboard. Simply switch from the “Data” tab to the “Style” tab. 

For this example, we changed the pie chart to have a “hole” in the middle. Feel free to style your elements however you feel fits best. You can edit colors, text, labels and much more. 

change styles How to build a Google Data Studio DashboardStylize your element

Scorecards

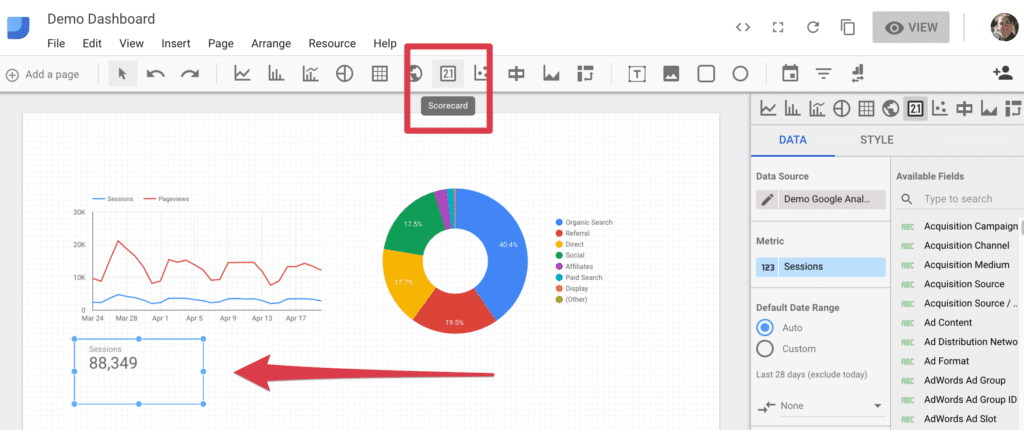
Scorecards are a powerful element that allows us to present raw metrics. For this example, let’s add a scorecard element under our line graph. 

add scorecard 1024x430 How to build a Google Data Studio DashboardAdd a scorecard

For this scorecard, we want to measure sessions. Simple select the “Sessions” metric. 

Often, your stakeholders will want to compare this metric to previous time periods. With the scorecard, we are able to easily add a comparison by selecting previous period. This will show what percentage increase/decrease you had from the previous period. 

compare How to build a Google Data Studio DashboardCompare with previous period

One scorecard may not be enough. Add additional scorecards for different metrics you want to track. For the dashboard, we used Sessions, Pageviews, Bounce Rate, Revenue and Transactions. 

Note: You can speed up the process by setting up your first scorecard, styling it and then copy/paste the additional scorecards. You can then quickly change the metric on each of these scorecards and have a much more uniform look.

add more scorecards 1024x217 How to build a Google Data Studio DashboardAdd additional scorecards

Tables

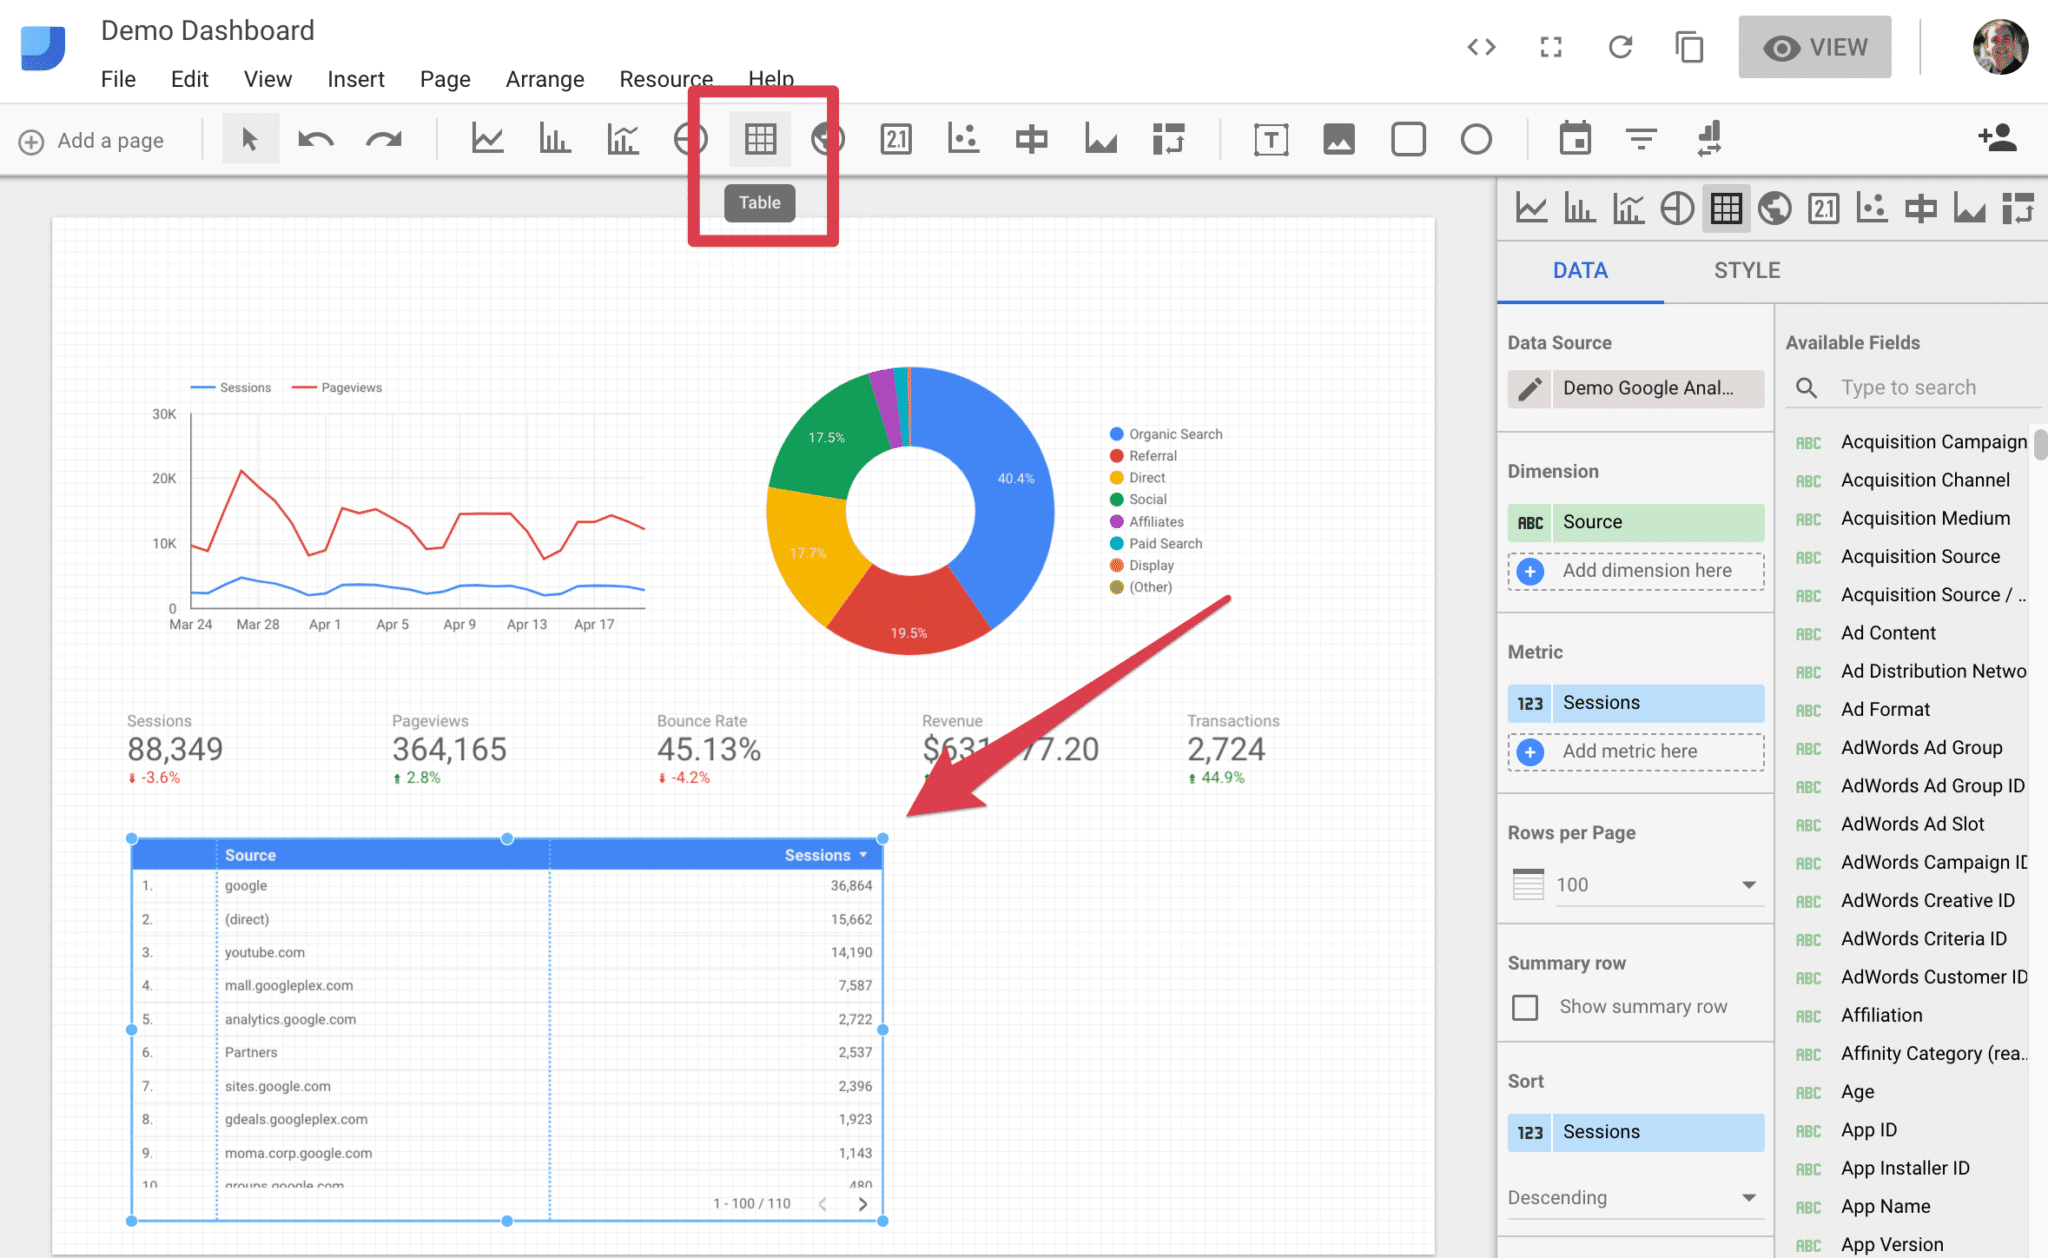
Tables are a great way to embed lists of data. Tables are scrollable and also allow for pagination. For our dashboard, let’s add a table that takes up about two-thirds of the screen. 

add table How to build a Google Data Studio DashboardAdd a table

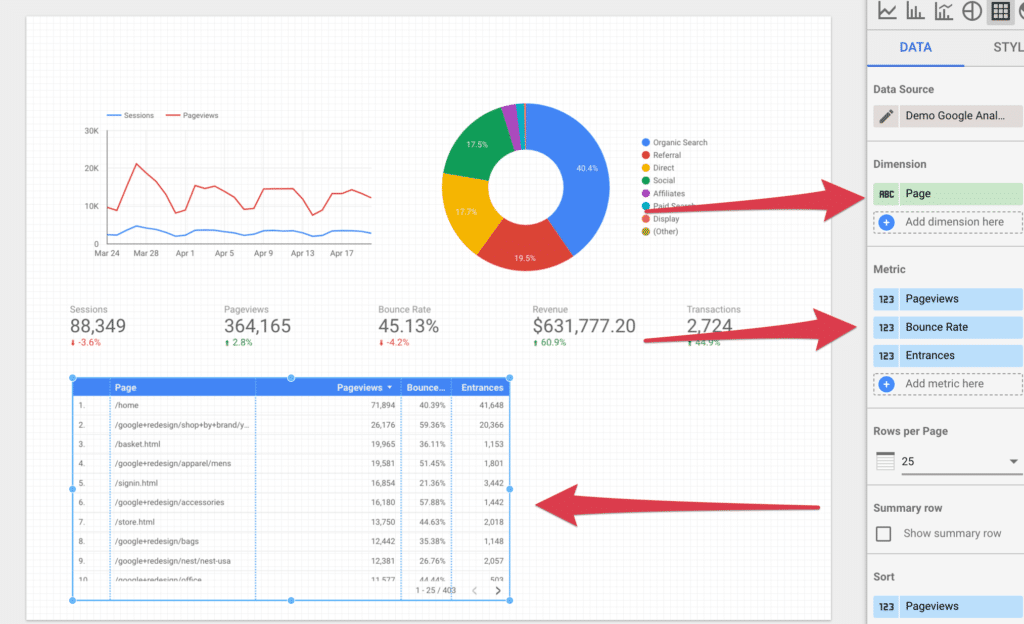
For our table, we want to display our pages in order of top pageviews and also show us the number of pageviews, entrances and bounce rate percentage. 

Set the dimension to “Page” and add “Pageviews”, “Bounce Rate” and “Entrances” as metrics. Your table should update immediately. You may need adjust each column width. 

set dimensions table 1 1024x624 How to build a Google Data Studio DashboardSetup dimensions and metrics

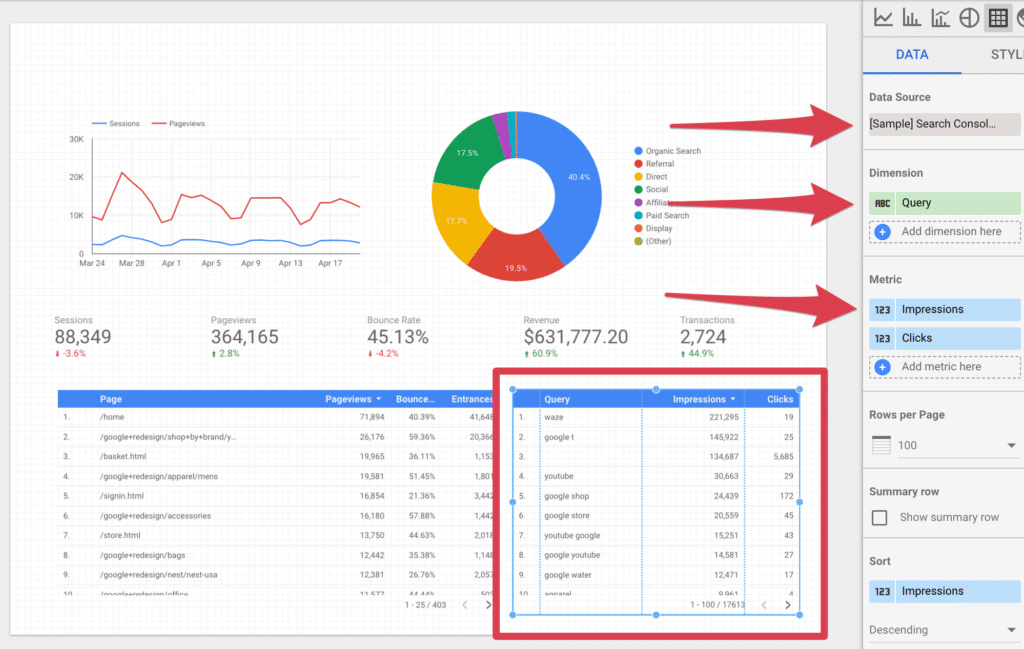
The final element we want to add to our dashboard is a table that pulls queries from Google Search Console. 

Simply add a table to the right of our previous table. Set the data source to be your Google Search Console data source we setup earlier. Next, select “Query” as our dimension. For metrics, let’s add “Impressions” and “Clicks”. 

add second table search console 1024x649 How to build a Google Data Studio DashboardAdd a second table & setup dimensions and metrics

Step 5: Adding Date Range Filter

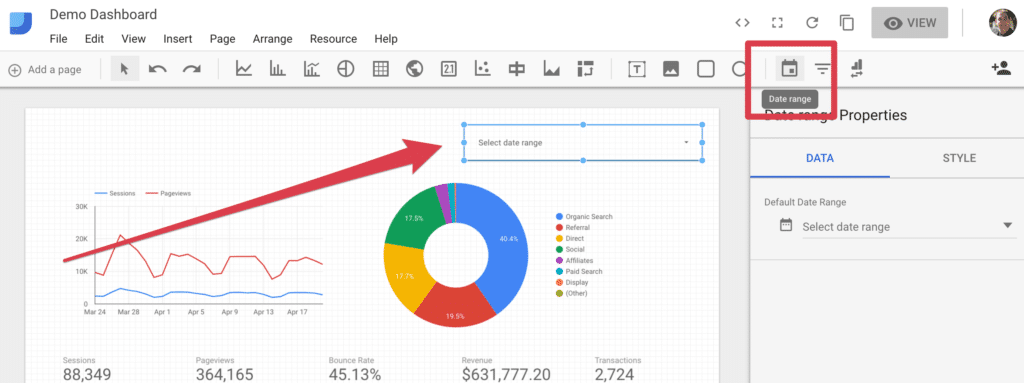
Currently, all the elements added to our dashboard are set to pull “Auto” as our date. By default this is pulling the last 28 days, but, what if you wanted to view a different date range?

Google Data Studio as an element known as a “Date Range” filter. This is added the same way as all other elements. Just select it from the menu bar and drag out a date range filter at an appropriate size.

add date range filter 1024x383 How to build a Google Data Studio DashboardAdd date range filter

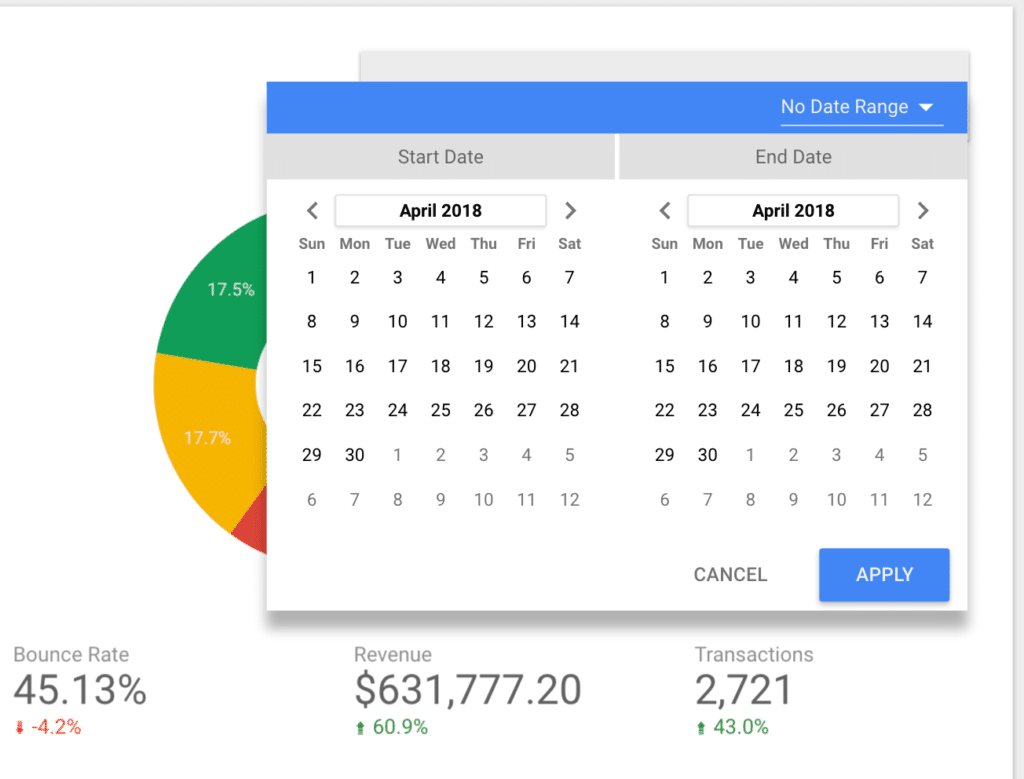
Once you add the filter, switch over to view mode and try it out. This allows you to select a date range for your dashboard. 

If you have any comparison elements set to the previous period, such as our scorecards, they will compare whatever date range you select to the previous period. For example, if your date range has 45 days in it, the comparison will be the 45 days prior to that range. 

date filter demo 1024x779 How to build a Google Data Studio DashboardView date range filter

You can also set a default date range on the “Data” tab for this date select. Often, I will set this to the last 30 days. You can also switch over to the “Style” tab to update the look of the date selector popup. 

Step 6: Add Text Headers & Images

Once elements have been added, you may have noticed that there are no headings. This can be confusing to anyone using your dashboard. Also, we may want to add some branding or images to help others make better sense of our newly created dashboard.

Text Headers

Google Data Studio makes adding text headers very simple with their “Text” element. Simply drag out a text box and add your text. Under text properties, update the size, color, and font-weight to achieve your desired look. 

text element google data studio 1024x223 How to build a Google Data Studio DashboardAdd text

Adding Images

There are several reasons as to why you may want to add images to your dashboard. The most common is to add your company’s branding.

Select the image element from the menu bar, drag a box onto your dashboard then click on “select a file” button on your “Data” tab. Browse you computer and find the image file you want to add. 

add images google data studio 1024x338 How to build a Google Data Studio DashboardAdd image

For our example, I have added our company logo to this report. You can resize the image or move it around your dashboard. 

logo added 1024x180 How to build a Google Data Studio DashboardOur added image

Step 7: Styling

Our dashboard has all the data we want to see, however, it doesn’t look amazing. With Google Data Studio, it is very simple to make style edits.

Global Styles

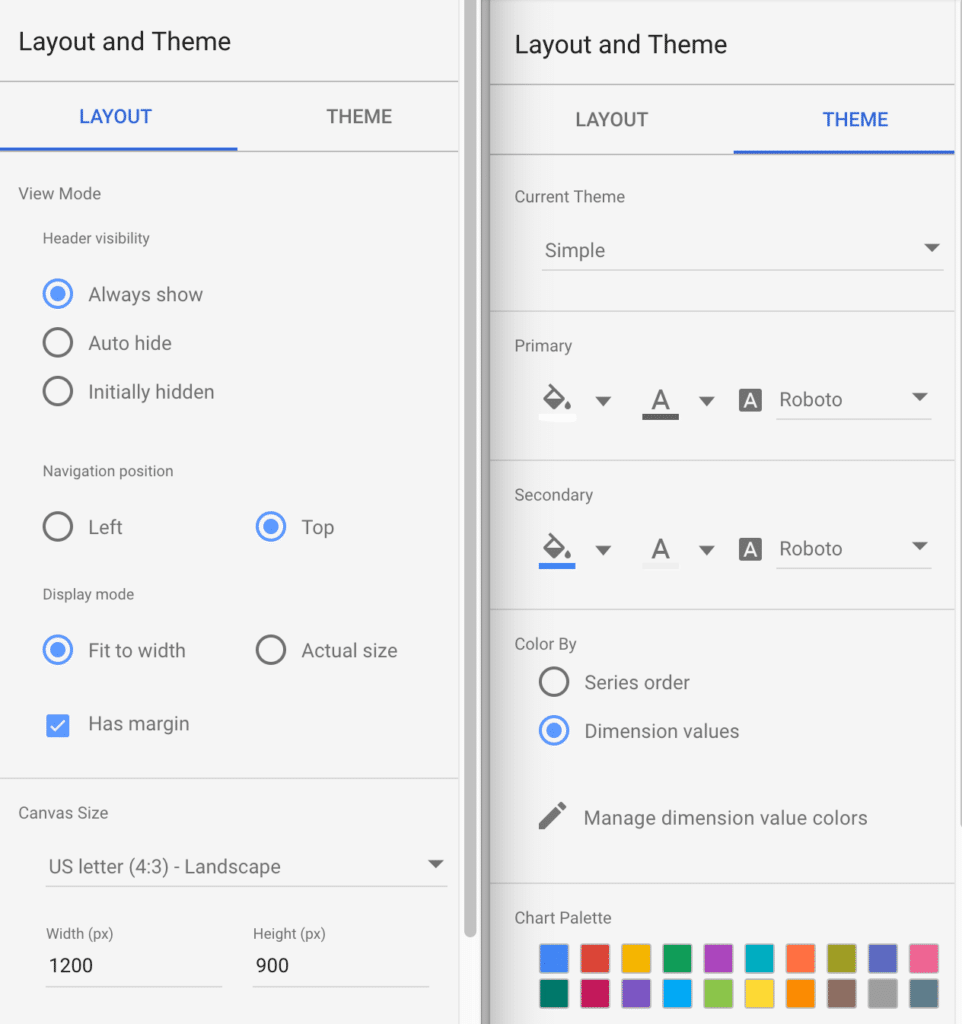
When you don’t have any elements selected, you should see the Layout and Theme sidebar. In this sidebar, we have the ability to control the overall layout and theme for our entire dashboard and all elements.

layout theme data studio 962x1024 How to build a Google Data Studio DashboardLayout & theme tabs

You can control your Primary and Secondary text color and font under the theme tab.

In addition, you can also pick your chart palette. Chart palette is the order of colors that will be used in all charts. For example, by default we have blue, red, yellow, green, etc. Notice in our pie chart on our dashboard, we have these same colors used in descending order. If you have brand colors, I would suggest changing these colors to your brands colors. Make sure the colors are different enough that you can make out which color represents different data. 

You can also control you background color of your dashboard and any borders globally.

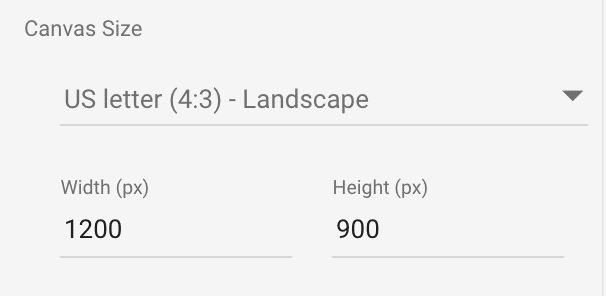
Finally, canvas size is under layout. This can be adjusted to make your dashboard whatever size you need it to be. You can select 16:9 to be used on a widescreen TV or just adjust the size to fit all the elements you need into one page. 

  • primary secondary How to build a Google Data Studio Dashboard
  • image How to build a Google Data Studio Dashboard
  • background border How to build a Google Data Studio Dashboard
  • canvas size How to build a Google Data Studio Dashboard
Element Styles

Each element in Google Data Studio has it’s own style that can be adjusted. It will automatically pull from the global styles, however, you can fine tune and even override the global styles on each element.

Most elements also contain additional elements that you can style. For example, a table has the ability to set the colors for alternating rows and to adjust headers. Pie charts allow you to change where the legend is positioned and alignment. Each element has it’s own styles. Take some time to explore each element.

Makeover Time

Alright, we have built our dashboard, we have added all the data, we have learned about how to style, now it is time to do a makeover of our dashboard. 

This is your dashboard so apply the unique look that you want. We applied our branding and here is our before and after.

image 1 1024x768 How to build a Google Data Studio DashboardBefore stylingafter 1024x766 How to build a Google Data Studio DashboardAfter syling

All Done

You have now created your first Google Data Studio dashboard. With practice, this becomes easier. You can make all kinds of different dashboards for all types of data. Your dashboards can be shared or even embedded into a website.

At Data Driven Labs, we love building complex Google Data Studio dashboards. If you need custom dashboards built for your business, contact us today.

Comment down below and let us know how your first dashboard turned out. If you have any questions, please feel free to submit them and we will work to get you an answer as soon as possible. 

share save 171 16 How to build a Google Data Studio Dashboard
Posted in Data Studio | Tagged | Comments Off on How to build a Google Data Studio Dashboard

RESPONSIVE SEARCH ADS: GOOGLE’S LATEST TEXT AD FORMAT

If you haven’t heard the news, Google recently launched a test of the newest text ad format: Responsive Search Ads.  The new ad format is currently in beta testing for a limited number of accounts, but we expect a similar format to eventually roll out to all advertisers.
What are they?
Responsive Search Ads allow Google to dynamically serve varying combinations of Headlines and Descriptions and optimize ad delivery based on the top-performing Headline and Description combinations.  These ads will appear in the same locations and will look like Expanded Text Ads, however Responsive Text Ads will include up to three Headlines.
Advertisers will upload up to 15 unique headlines and up to 4 unique descriptions for Google to utilize in ad delivery.  Google included a feature that allows advertisers to ‘pin’ a headline variation to a desired headline position.  A “pinned” Headline will show in the desired Headline position across all variations of the Responsive Search Ads.  This feature gives the advertiser some control over messaging, while still allowing Google to optimize ad delivery based on how the other Headlines or Description performs.
Character limits have been updated for Responsive Search ads.  Headline character limit remains unchanged, with a 30-character limit.  Description headlines are slightly longer than Expanded Text Ads, with a 90-character limit.  Path 1 and Path 2 character limits remain unchanged at 15 characters.
Responsive Text Ads will be available through the updated AdWords interface and the latest version of AdWords editor for accounts with access to the test. Advertisers need to run Expanded Text Ads in any Ad Group that also contains Responsive Text Ads. Google doesn’t currently offer the ability for Responsive Text Ads to run in an Ad Group that doesn’t contain Expanded Text Ads.
Impact
The Responsive Text Ad test represents the next step on Google’s journey toward greater integration of machine learning in AdWords.  The new ad format and move toward machine learning should be positive news for most advertisers in the industry.
Responsive Text Ad’s ability to dynamically test ad copy will allow agencies and in-house teams to move away from traditional A/B testing by testing multiple variations of ad copy at a time.  Testing multiple ad copy variations at a time will give markets the ability to gain ad copy insights that were only previously available through multiple rounds of A/B tests.
The benefits of Responsive Text Ads should also extend to smaller businesses or marketing teams with limited resources.  The improved automation of ad testing provides small teams the opportunity to focus time and energy on other aspects of their accounts.  The ability for Google to optimize ad delivery over time will be helpful for small business owners who don’t have time to update their accounts regularly.
Regardless of the size of your team, having more Headlines (up to three) and higher character limits in the Description (90 characters) will give the Responsive Text Ads more real estate on the search results page.  Because of the greater size, we are expecting higher click-through-rates on Responsive Text ads compared to Expanded Text Ads.  The benefit of having larger ads should be reason enough to test these ads.
Conclusion
Only time will tell if Google decides to roll the Responsive Text Ads out for all advertisers.  If history tells us anything about Google’s dedication to using machine learning, I expect Responsive Text Ads to roll out for all advertisers before the end of the year.
By Mark Ferree | Account Manager at Hanapin Marketing

If you haven’t heard the news, Google recently launched a test of the newest text ad format: Responsive Search Ads.  The new ad format is currently in beta testing for a limited number of accounts, but we expect a similar format to eventually roll out to all advertisers.What are they?Responsive Search Ads allow Google to dynamically serve varying combinations of Headlines and Descriptions and optimize ad delivery based on the top-performing Headline and Description combinations.  These ads will appear in the same locations and will look like Expanded Text Ads, however Responsive Text Ads will include up to three Headlines.
Advertisers will upload up to 15 unique headlines and up to 4 unique descriptions for Google to utilize in ad delivery.  Google included a feature that allows advertisers to ‘pin’ a headline variation to a desired headline position.  A “pinned” Headline will show in the desired Headline position across all variations of the Responsive Search Ads.  This feature gives the advertiser some control over messaging, while still allowing Google to optimize ad delivery based on how the other Headlines or Description performs.
Character limits have been updated for Responsive Search ads.  Headline character limit remains unchanged, with a 30-character limit.  Description headlines are slightly longer than Expanded Text Ads, with a 90-character limit.  Path 1 and Path 2 character limits remain unchanged at 15 characters.
Responsive Text Ads will be available through the updated AdWords interface and the latest version of AdWords editor for accounts with access to the test. Advertisers need to run Expanded Text Ads in any Ad Group that also contains Responsive Text Ads. Google doesn’t currently offer the ability for Responsive Text Ads to run in an Ad Group that doesn’t contain Expanded Text Ads.ImpactThe Responsive Text Ad test represents the next step on Google’s journey toward greater integration of machine learning in AdWords.  The new ad format and move toward machine learning should be positive news for most advertisers in the industry.
Responsive Text Ad’s ability to dynamically test ad copy will allow agencies and in-house teams to move away from traditional A/B testing by testing multiple variations of ad copy at a time.  Testing multiple ad copy variations at a time will give markets the ability to gain ad copy insights that were only previously available through multiple rounds of A/B tests.
The benefits of Responsive Text Ads should also extend to smaller businesses or marketing teams with limited resources.  The improved automation of ad testing provides small teams the opportunity to focus time and energy on other aspects of their accounts.  The ability for Google to optimize ad delivery over time will be helpful for small business owners who don’t have time to update their accounts regularly.
Regardless of the size of your team, having more Headlines (up to three) and higher character limits in the Description (90 characters) will give the Responsive Text Ads more real estate on the search results page.  Because of the greater size, we are expecting higher click-through-rates on Responsive Text ads compared to Expanded Text Ads.  The benefit of having larger ads should be reason enough to test these ads.ConclusionOnly time will tell if Google decides to roll the Responsive Text Ads out for all advertisers.  If history tells us anything about Google’s dedication to using machine learning, I expect Responsive Text Ads to roll out for all advertisers before the end of the year.
By Mark Ferree | Account Manager at Hanapin Marketing

share save 171 16 RESPONSIVE SEARCH ADS: GOOGLE’S LATEST TEXT AD FORMAT
Posted in Adwords | Tagged | Comments Off on RESPONSIVE SEARCH ADS: GOOGLE’S LATEST TEXT AD FORMAT

Privacy Policy

This Privacy Policy governs the manner in which seo collects, uses, maintains and discloses information collected from users (each, a “User”) of the http://seowe.com website (“Site”).
Personal identification information
We may collect personal identification information from Users in a variety of ways, including, but not limited to, when Users visit our site, fill out a form, and in connection with other activities, services, features or resources we make available on our Site. Users may be asked for, as appropriate, name, email address, mailing address, phone number. Users may, however, visit our Site anonymously. We will collect personal identification information from Users only if they voluntarily submit such information to us. Users can always refuse to supply personally identification information, except that it may prevent them from engaging in certain Site related activities.
Non-personal identification information
We may collect non-personal identification information about Users whenever they interact with our Site. Non-personal identification information may include the browser name, the type of computer and technical information about Users means of connection to our Site, such as the operating system and the Internet service providers utilized and other similar information.
Web browser cookies
Our Site may use “cookies” to enhance User experience. User’s web browser places cookies on their hard drive for record-keeping purposes and sometimes to track information about them. User may choose to set their web browser to refuse cookies, or to alert you when cookies are being sent. If they do so, note that some parts of the Site may not function properly.
How we use collected information
seo may collect and use Users personal information for the following purposes:
– To run and operate our Site
We may need your information display content on the Site correctly.
– To improve customer service
Information you provide helps us respond to your customer service requests and support needs more efficiently.
– To send periodic emails
We may use the email address to respond to their inquiries, questions, and/or other requests.
How we protect your information
We adopt appropriate data collection, storage and processing practices and security measures to protect against unauthorized access, alteration, disclosure or destruction of your personal information, username, password, transaction information and data stored on our Site.
Sharing your personal information
We do not sell, trade, or rent Users personal identification information to others. We may share generic aggregated demographic information not linked to any personal identification information regarding visitors and users with our business partners, trusted affiliates and advertisers for the purposes outlined above.
Compliance with children’s online privacy protection act
Protecting the privacy of the very young is especially important. For that reason, we never collect or maintain information at our Site from those we actually know are under 13, and no part of our website is structured to attract anyone under 13.
Changes to this privacy policy
seo has the discretion to update this privacy policy at any time. When we do, we will revise the updated date at the bottom of this page. We encourage Users to frequently check this page for any changes to stay informed about how we are helping to protect the personal information we collect. You acknowledge and agree that it is your responsibility to review this privacy policy periodically and become aware of modifications.
Your acceptance of these terms
By using this Site, you signify your acceptance of this policy. If you do not agree to this policy, please do not use our Site. Your continued use of the Site following the posting of changes to this policy will be deemed your acceptance of those changes. This privacy policy was built with the https://PrivacyPolicies.com generator.
Contacting us
If you have any questions about this Privacy Policy, the practices of this site, or your dealings with this site, please contact us.
This document was last updated on May 10, 2018

This Privacy Policy governs the manner in which seo collects, uses, maintains and discloses information collected from users (each, a “User”) of the http://seowe.com website (“Site”).
Personal identification information
We may collect personal identification information from Users in a variety of ways, including, but not limited to, when Users visit our site, fill out a form, and in connection with other activities, services, features or resources we make available on our Site. Users may be asked for, as appropriate, name, email address, mailing address, phone number. Users may, however, visit our Site anonymously. We will collect personal identification information from Users only if they voluntarily submit such information to us. Users can always refuse to supply personally identification information, except that it may prevent them from engaging in certain Site related activities.
Non-personal identification information
We may collect non-personal identification information about Users whenever they interact with our Site. Non-personal identification information may include the browser name, the type of computer and technical information about Users means of connection to our Site, such as the operating system and the Internet service providers utilized and other similar information.
Web browser cookies
Our Site may use “cookies” to enhance User experience. User’s web browser places cookies on their hard drive for record-keeping purposes and sometimes to track information about them. User may choose to set their web browser to refuse cookies, or to alert you when cookies are being sent. If they do so, note that some parts of the Site may not function properly.
How we use collected information
seo may collect and use Users personal information for the following purposes: – To run and operate our SiteWe may need your information display content on the Site correctly. – To improve customer serviceInformation you provide helps us respond to your customer service requests and support needs more efficiently. – To send periodic emailsWe may use the email address to respond to their inquiries, questions, and/or other requests.
How we protect your information
We adopt appropriate data collection, storage and processing practices and security measures to protect against unauthorized access, alteration, disclosure or destruction of your personal information, username, password, transaction information and data stored on our Site.
Sharing your personal information
We do not sell, trade, or rent Users personal identification information to others. We may share generic aggregated demographic information not linked to any personal identification information regarding visitors and users with our business partners, trusted affiliates and advertisers for the purposes outlined above.
Compliance with children’s online privacy protection act
Protecting the privacy of the very young is especially important. For that reason, we never collect or maintain information at our Site from those we actually know are under 13, and no part of our website is structured to attract anyone under 13.
Changes to this privacy policy
seo has the discretion to update this privacy policy at any time. When we do, we will revise the updated date at the bottom of this page. We encourage Users to frequently check this page for any changes to stay informed about how we are helping to protect the personal information we collect. You acknowledge and agree that it is your responsibility to review this privacy policy periodically and become aware of modifications.
Your acceptance of these terms
By using this Site, you signify your acceptance of this policy. If you do not agree to this policy, please do not use our Site. Your continued use of the Site following the posting of changes to this policy will be deemed your acceptance of those changes. This privacy policy was built with the https://PrivacyPolicies.com generator.
Contacting us
If you have any questions about this Privacy Policy, the practices of this site, or your dealings with this site, please contact us.
This document was last updated on May 10, 2018

share save 171 16 Privacy Policy
Posted in Google | Tagged | Comments Off on Privacy Policy

The Brand-New Strategy for Increasing Email Open Rates by 5X [Infographic]

Optimizing prospecting and sales emails is something you could probably dedicate the rest of your life to. You might even argue that that’s a good part of what you’ve been doing to this point. Because, if your sales team can’t stand out in the inbox, grab attention, and ignite a response from their prospects or accounts, how are they going to close a deal?

They’re probably not. Or, they’ll at least struggle a lot.

Which is why it’s exciting when a new tactic is uncovered that will significantly improve open, click-through, and response rates.

We’ve seen that happen with video.

Reps that use video in prospecting, relationship-building, and sales emails see 5x higher open rates and 8x higher open-to-reply rates. And they’re just getting started.

As sales leaders learn that video is the next generation of sales communication, they’re starting to ask not “Why should I be using video?” but “How should I be using video?”

Take a look at the videos you should use for reaching out to new prospects, keeping in touch with existing ones, and closing deals.

10 Ways to Use Video in Sales 2.png?t=1525094353438&width=730&height=347&name=10 Ways to Use Video in Sales 2 The Brand New Strategy for Increasing Email Open Rates by 5X [Infographic]

Let’s delve into using video in the three main types of emails. 

What to skip straight to the infographic? I’ve got you covered.

Using Video in Prospecting Emails

When you’re freshly reaching out to a new lead, it’s so important that you stand out and get noticed. Prospecting emails have to stick out in crowded inboxes. For BDR and SDR teams, the best opportunities to spice up those prospecting emails with video are:

  • Prospecting
  • Follow up
  • Account-based selling

The biggest things to keep in mind here are similar in nature to any other form of prospecting: You’re trying to capture attention with an audience that doesn’t really know you yet. You’ll want to focus your videos on:

  • Capturing attention: Use “video” in your email subject lines and include the thumbnail in the email body
  • Establishing credibility: Reps should give their prospects a reason to engage with them other than pulling out their checkbook right away
  • Making it personal: Top reps spend time learning about an individual and their business and then use this info to connect with leads individually

Try this template:

[Prospect], I made you a personal video

Hi [prospect],

As the [title] at [prospect’s company], I imagine you’re focused on improving [relevant item]. I put together a 45-second video explaining how [rep’s company] can [do X, improve Y, solve Z]. 

[Video]

Looking forward to sharing more best practices. How does [date and time] work
for an introductory call?

Best,
[Name]

send now hubspot sales bar.png?t=1525094353438&width=1000&name=send now hubspot sales bar The Brand New Strategy for Increasing Email Open Rates by 5X [Infographic]

Using Video in Relationship-Building Emails

Sometimes, you already know your leads. You don’t need to introduce yourself and establish your position in the market: Your leads already know this information. But you do need to stay top-of-mind to keep building the relationship and be there when it comes time for them to make a decision. Focus your videos on:

  • Sharing marketing content
  • Using content from the web
  • Saying hello

Remember to:

  • Make the content hyper-relevant: Encourage your reps to keep their own, detailed notes on various leads and consume content in areas they’re familiar with.
  • Be approachable and encourage dialogue: Reps should give prospects a reason to respond so they can have a conversation, not a one-way broadcast.
  • Think about how your reps can help them: Their communication should be helpful and educational so they can build mutually beneficial relationships.

Try this template:

Check out this video, [prospect]

Hi [prospect],

Seeing your recent post [on LinkedIn, your blog, your company’s website], I thought you might find our recent report on [related topic] helpful.

Here’s the free download to [recent update, whitepaper, blog post]. I’ve put together a video summary here — there’s a particularly [interesting, relevant, valuable] point near the end.

[Video]

Hope you enjoy!
[Name]

send now hubspot sales bar.png?t=1525094353438&width=1000&name=send now hubspot sales bar The Brand New Strategy for Increasing Email Open Rates by 5X [Infographic]

Using Video in Selling Emails

Continue to use video as leads get closer to the bottom of the funnel and are passed off to an account executive (AE). The most effective video types at this stage include:

  • Micro-demos
  • Follow up
  • Check-ins with existing customers
  • Breakup videos with prospects who have gone cold

In selling emails that are getting closer to the close, it’s important to:

  • Tie your company’s value prop to the prospect and their needs: Just like any sales pitch, they need your reps to do the heavy lifting for them. Videos should answer the question, “Why do they need your product and how can you help them?”
  • Be confident, but not pushy: Leads want to know that your team knows their stuff, but no one wants to be strong-armed into a deal.
  • Make it personal and connect one-to-one: People do deals with people. If your AEs can build camaraderie with their accounts, they’ll have the upper hand.

Try this template:

60-second video for [prospect’s company]

Hi [prospect],

With your role in [department, company], I thought it would be great to share
[statistic on problem your company solves]. I wanted to send you a short 60-second video I created on how [rep’s company] can [your company value prop as it relates to the statistic above] this year. Take a minute to watch this video because:

[Video]

I’ll follow up after you’ve had the chance to watch the video. Looking
forward to sharing more details on how this can align to your 2017 big bets.

Best,
[Name]

send now hubspot sales bar.png?t=1525094353438&width=1000&name=send now hubspot sales bar The Brand New Strategy for Increasing Email Open Rates by 5X [Infographic]

Why Video is Invaluable in Sales [Infographic]

HUBSPOT Sales Infographic final 01 compressor.jpg?t=1525094353438&width=700&height=4385&name=HUBSPOT Sales Infographic final 01 compressor The Brand New Strategy for Increasing Email Open Rates by 5X [Infographic]

Check out Vidyard’s Video Selling Institute for more information on using video in sales.

Editor’s note: This post originally appeared on Vidyard and has been republished here with permission.

share save 171 16 The Brand New Strategy for Increasing Email Open Rates by 5X [Infographic]
Posted in MA | Tagged | Comments Off on The Brand-New Strategy for Increasing Email Open Rates by 5X [Infographic]

The Ultimate Marketing Automation statistics overview

1. ADOPTION and MARKETGROWTH of MARKETING AUTOMATION

marketing automation numbers The Ultimate Marketing Automation statistics overview

67% of Marketing Leaders currently use a Marketing Automation Platform. – Salesforce “State of Marketing” (2017)

35,2 % of the respondents said they currently utilize marketing automation. 64,8 % answered that marketing automation isn’t being used yet by their company. – Liana “The Benefits and Challenges of Marketing Automation” (2017)

Over the next two years, an additional 21% of Marketing Leaders plan to use a Marketing Automation Platform. – Salesforce “State of Marketing” (2017)

Almost 40 % of those not yet using marketing automation are going to invest in it in the next 12 months. Only a tenth of the respondents don’t plan to invest in marketing automation within the next 12 months. – Liana “The Benefits and Challenges of Marketing Automation” (2017)

91% of the most successful users agree that marketing automation is “very important” to the overall success of their marketing across channels. – Marketo & Ascend2 “Marketing Automation Strategies for Sustaining Success” (2015)

b2b marketing automation systems revenue US The Ultimate Marketing Automation statistics overview

The US Marketing Automation Software industry is a $3.3B market in 2017, growing 30%+ annually – SharpSpring“Investor Presentation Jan 2018” (2018)

Nearly two-thirds (63%) of the “Very successful” use their marketing automation systems extensively, while more than a third (37%) achieved best-in-class status with limited use. – Three Deep & Ascend2 “Marketing Automation Trends for Success” (2016)

27% of companies rate say they are at Marketing automation maturity level “New”. – LeadMD “The 2016 Marketing Maturity Benchmark Report” (2016)

Only 21% of respondents reported an individual maturity level of above average or higher with Marketing automation – LeadMD “The 2016 Marketing Maturity Benchmark Report” (2016)

63% of companies successful in Marketing Automation plan to increase their Marketing Automation budget. The companies with successful marketing automation programs will invest in further success in the coming year. – Marketo & Ascend2 “Marketing Automation Strategies for Sustaining Success” (2015)

63% of companies outsource all or part of marketing automation strategy planning. 51% uses a combination of outsourced and in-house resources, 12% outsourced all to a specialist. 37% uses inhouse resources only. – Ascend2 “Marketing Automation Trends Survey” (2016).

The majority of users think Marketing Automation is worth the price. 10% finds it inexpensive, 47% fairly priced, 22% pricey but worth it and 11% too expensive. 10% was not sure. – VB Insight “Marketing Automation, how to make the right buying decision” (2015)

Slide12 0 The Ultimate Marketing Automation statistics overview

8% of B2C and 21% of B2B marketers find Marketing Automation one of their Top Digital Priorities. – Adobe“Quarterly Digital Intelligence Briefing” (2014)

61% of respondents are not using marketing automation at all and the remaining responses were split over a large range of 27 different vendors and combinations of solutions. – TFM&A “The 2015 Marketing Technology Report” (2015)

Marketing automation is used by 42% of companies, CRM / sales automation systems by 54%, while Email marketing technology has the highest adoption. It is used by 82% of companies. – Ascend2 “Marketing Technology Strategy” (August 2015)

ascend2 technology types 2015 The Ultimate Marketing Automation statistics overview

Nearly 70% of businesses are using a marketing automation platform (MAP) or currently implementing one. – Aberdeen Group “State of Marketing Automation 2014: Processes that Produce” (2014)

42% of CRM users plan to increase spending in marketing automation, – Software Advice “Customer Relationship Management Software UserView” (2014)

43% of companies using a marketing automation platform (MAP) have been doing so for over 4 years.Aberdeen Group “State of Marketing Automation 2014: Processes that Produce” (2014)

lead generation marketing automation The Ultimate Marketing Automation statistics overview

26% of marketers make extensive use of marketing software to manage lead generation, 36% make limited use of marketing software for it. – Ascend2 “Lead Generation Strategy Survey” (2014)

25% of Fortune 500 B2B companies have adopted marketing automation. – ClickZ Fortune 500 B2B Adoption of Marketing Tools study (2013)

19% indicated they switched Marketing Automation Providers (MAP) providers recently or were currently doing so. – Aberdeen Group “State of Marketing Automation 2014: Processes that Produce” (2014)

Adoption and Investments in Marketing automation differs heavily per industry.
industry adoption of marketing automation The Ultimate Marketing Automation statistics overview

  • Maintainers (technology, financial markets, life sciences, and oil and gas industries) are fine-tuning their earlier marketing automation investments.
  • Transformers (insurance, health insurance, media, retail, and telecoms) are investing in business change, of which marketing automation is potentially a key component.
  • Skeptics (manufacturing, professional services, and retail banking) are evaluating how marketing automation can best be applied to their industries.
  • Laggards (higher education, education, government, healthcare, and utilities) are yet to actively consider wholesale adoption of marketing automation.

Ovum “Industry Adoption of Marketing Automation in Europe” (dec 2013)

66% of average performing B2B companies indicates that their current technologies are sufficient to scale end-to-end marketing over the next 1-3 years. For 34% they aren’t. ACT-ON and Gleanster Research “Rethinking the Role of Marketing “ (2015)

53% of all respondents are currently using or applying marketing automation. Another 17% are currently evaluating or considering marketing automation. Pepper Global “B2B Marketing Automation Report 2014”

In the America’s there are significantly higher adoption with 69% of respondents using or applying marketing automation. In EMEA this is 39% and in APAC only 36%. – Pepper Global “B2B Marketing Automation Report 2014”

97% of B2B respondents used email marketing software. Customer relationship management (CRM) and marketing automation suites were the next most commonly used technologies, at 97 and 96 percent.B2B – Software Advice and Research Now “Demand Generation Benchmark” (2014)

top preformers use marketingautomation gleanster The Ultimate Marketing Automation statistics overview

Of the top performers in B2B 69% use Marketing automation for Customer acquisition and 50% for Customer Retention. – ACT-ON and Gleanster Research “Rethinking the Role of Marketing “ (2015)

53% of the B2B organizations surveyed have adopted marketing automation systems, a greater number than the 43% adoption rate at organizations identified as B2C and combination B2B / B2C organizations. – ResearchCorp“Demand Generation Adoption Survey” (2014)

In higher revenue tiers, a higher percentage of companies have adopted Marketing automation.

  • 60% in companies with over $500M revenue,
  • 10% in companies with $20M – $500M revenue,
  • 5% in companies with $5M – $20M revenue,
  • 3% in micro companies with less than < $5M revenue

Raab Associates “Marketing Automation 2014 Industry Overview” (2014).

20% of agencies make extensive use of marketing automation. Only 30% of agencies aren’t using marketing automation to distribute content, prove inbound marketing ROI, and improve inbound effectiveness with personalized targeting. SharpSpring & Ascend2“Inbound marketing: Benchmarks from the Agency Perspective” (2014)

58% of top-performing companies; where marketing contributes more than half of the sales pipeline, have adopted marketing automation. – Forrester Research “Gauging Your Progress and Success” (2013)

33% have already implemented marketing automation software within their businesses and half of all respondents of (Faststats software users) plan, or aspire, to do so. 11% plan to implement marketing automation immediately and 19% within the next year. Only a few respondents said they weren’t (3%), or were unlikely (5%) to implement marketing automation software. – Source: Apteco Ltd “Trend Report Data driven marketing 2014 / 2015”

Apteco DataDrivenMarketingTrendReport2014 2015 The Ultimate Marketing Automation statistics overview

Source: Apteco Ltd “Trend Report Data driven marketing” (2015)

63% of B2B marketers allocate 10–29% of their marketing budget to marketing automation. – Pepper Global “B2B Marketing Automation Report 2014”

marketing automation budget The Ultimate Marketing Automation statistics overview

For a majority of B2B marketers, marketing automation budgets stay flat (48%) or increases (41%) in the coming year. – Pepper Global “B2B Marketing Automation Report 2014”

23% of marketers are not using Lead Generation Marketing Software at the moment, but are planning to in the future. – Ascend2 “Lead Generation Strategy Survey” (2014)

Marketing automation adoption is higher in companies with more employees. Adoption is 76% of companies with >100 employees, 26% in mid-sized companies of 10-100 employees and 18% amongst companies with Buyer Zone “The State of B2B Lead Generation 2013 Report” (2013)

91% of buyers in 2013 were evaluating marketing automation for the first time. – SoftwareAdvice “Marketing Automation Software BuyerView” (2014)

2. Benefits and Goals of Marketing Automation

Nearly two thirds of companies surveyed (63%) expect to realize the benefits of their marketing automation system within six months of implementation. – Ascend2 “Marketing Automation Trends Survey” (2016).

benefits marketing automation liana The Ultimate Marketing Automation statistics overview

Almost 70% of the respondents finds improved targeting of messages is the most important benefit of marketing automation. – Liana “The Benefits and Challenges of Marketing Automation” (2017)

Improved customer experience (45,9 %), improved quality of leads (37,7 %) and an increased number of leads (34,9 %) are deemed important benefits of marketing automation. – Liana “The Benefits and Challenges of Marketing Automation” (2017)

Marketers say the most important objectives of a marketing automation strategy are:

  • Optimizing productivity (43%)
  • Increasing marketing ROI (41%)
  • Improving campaign management (40%)
  • Improving database quality (39%)
  • Acquiring more customers (39%)
  • Measuring performance (37%)
  • Aligning Marketing and Sales (24%)

Adestra “State of Marketing Automation Benchmarks for Success” (2017)

state of marketing automation objectives marketing automation The Ultimate Marketing Automation statistics overview

Only 24% of top marketers included alignment with sales as a priority for marketing automation. This is a potential miss. – Adestra “State of Marketing Automation Benchmarks for Success” (2017)

timeframe marketing automation implementation The Ultimate Marketing Automation statistics overview

Marketers say that the biggest benefits of Automation are Saving time (74%), Increased customer engagement (68%), More timely communications (58%) and Increased opportunities including up-selling (58%) – AdestraMarketer vs Machine (2015)

45% of agencies rely on marketing automation platforms to show ROI and 42% use marketing automation to measure performance – SharpSpring State of Marketing Automation for Agencies” (2017)

marketing automation agencies The Ultimate Marketing Automation statistics overview

42% of agencies note client acquisition as a top objective in their marketing automation strategy. – SharpSpringState of Marketing Automation for Agencies” (2017)

60% of B2B marketers say they’ve been more focused on improving audience segmentation and personas over the past 18 months. – Salesforce “State of Marketing” (2017)

top marketing automation goals marketing automation The Ultimate Marketing Automation statistics overview

92% report improving their qualified Lead pipeline as a top organisational goal. Followed by Customer retention (81%) and Lead/Pipeline velocity (Nuture, edication and price insulation) with 66% – LeadMD “The 2016 Marketing Maturity Benchmark Report” (2016)

Increasing sales revenue (53%), lead nurturing (43%) and customer engagement (37%) are the most important objectives of a marketing automation strategy. – Marketo & Ascend2 “Marketing Automation Strategies for Sustaining Success” (2015)

B2B marketers say the #1 benefit of marketing automation is the ability to generate more and better leads. – Pepper Global “Marketing Automation Trends Report 2014” (2013)

The most important strategic goals of a marketing automation strategy are Increasing lead generation (61%), lead nurturing (57%) and sales revenue (47%). Next are Improving customer engagement (36%), marketing productivity (29%), improve measurability (28%) and campaign targeting (22%). – Ascend2 “Marketing Automation Trends Survey” (2016).

3. Marketing Automation Results

High Performers are 3.2x more likely that underpreformers to say their technology stack is extremely or very effective at collaboration across marketing functions. – Salesforce “State of Marketing” (2017)

effective salesstack state of marketnig The Ultimate Marketing Automation statistics overview

High Performers are 2.6x more likely that underpreformers to say their technology stack is extremely or very effective at delivering marketing efficiencies like automation. – Salesforce “State of Marketing” (2017)

marketing automation agency success The Ultimate Marketing Automation statistics overview

Nearly 90% of agencies say their marketing automation strategy is successful, while only 2% count themselves as “worst in class.” – SharpSpring State of Marketing Automation for Agencies” (2017)

Only 8% of companies see increased revenues within 6 months of adopting marketing automation. After one year of MA use 32% claim to see increased revenue. For those to have been using it for more than two years the figure is 40%. – B2Bmarketing.net and Circle Research “Benchmarking Report Marketing automation” (2015)

econsultancy automation success The Ultimate Marketing Automation statistics overview

33% of company respondents still consider their automated email marketing programmes to be not successful. Only 8% deemed their efforts very successful. – eConsultancy “Email Marketing Industy Census” (2017)

80% of marketing automation users saw their number of leads increase, and 77% saw the number of conversions increase. – VB Insight “Marketing Automation, how to make the right buying decision” (2015)

lead lift marketing automation leadmd The Ultimate Marketing Automation statistics overview

Half of the companies reported no increase at all in qualified Leads since implementing Marketing Automation, while only 19% saw a dramatic increase in qualified leads with marketing automation. – LeadMD “The 2016 Marketing Maturity Benchmark Report” (2016)

17% say marketing Automation has been very beneficial for their company, 57% quite beneficial, 26% see limited to no benefit. – B2Bmarketing.net and Circle Research “Benchmarking Report Marketing automation” (2015)

top benefits by time of adoption The Ultimate Marketing Automation statistics overview

27% of those new to the technology report “More relevant messages” as a result, but that increases with time to 74% for the veteran Marketing automation users started using MA more than two years ago. – B2Bmarketing.net and Circle Research “Benchmarking Report Marketing automation” (2015)

Only 32% of companies consider marketing automation “Very successful” at achieving their important goals.Three Deep & Ascend2 “Marketing Automation Trends for Success” (2016)

pipeline marketing and roi The Ultimate Marketing Automation statistics overview

Marketers familiar with pipeline marketing are 48% more likely to see ROI greater than 1.5x. Marketers who identify as pipeline marketers are 119% more likely to report sales and marketing alignment. – Heinz, Reachforce and research partners “The State of Pipeline Marketing Report” (2016)

67% of B2B marketers say they see at least 10% increase in sales opportunities through lead nurturing, with 15% seeing opportunities increase by 30% or more. – DemandGen “2014 Lead Nurturing Benchmark Study” (Oct 2014)

The most useful metrics for measuring marketing automation performance are Conversion Rate and Revenue Generated , say 58% of best in class Marketing Automation users. – Three Deep & Ascend2 “Marketing Automation Trends for Success” (2016)

marketing automation metrics The Ultimate Marketing Automation statistics overview

B2B marketers who implement marketing automation increase their sales-pipeline contribution by 10%. Forrester Research “The Forrester Wave Lead-To-Revenue Management Platform Vendors” (2014)

Marketing automation high performers have an average of 60% higher lead-to-sale conversion rating. These high performers rate cost of customer acquisition (COCA) 1.4x stronger – PR20/20 “Marketingscore report” (2014)

B2B marketers see an average 20% increase in sales opportunities from nurtured leads versus non-nurtured leads after successfully deploying a lead nurturing program – DemandGen “Calculating the Real ROI from Lead Nurturing” (Aug 2013

Companies that have adopted marketing automation perform well compared to companies that haven’t:

  • 45% regularly repurpose content for efficiency, compared with 28% of companies without marketing automation
  • 54% capture intelligence for the sales team, compared to 25% without marketing automation
  • 49% customize content to the Buyer Journey stages, compared to 21% without marketing automation
  • 59% can use intelligent targeting to trigger content, compared to 17% without marketing automation

– The Lenskold Group, “2013 Lead-Generation Marketing Effectiveness Study” (2013)

Companies using marketing automation see 53% higher conversion rates from initial response-to-MQL and a revenue growth rate that is 3.1% higher than non-users. – Aberdeen Group “Marketing Lead Management Report” (2012)

63% of companies that are outgrowing their competitors use marketing automation. – The Lenskold Group “2013 Lead Generation Marketing Effectiveness Study” (2013)

After implementing a marketing automation platform the increased collaboration between sales and marketing leads to:

  • 17% advantage in capturing insight from prospects and customers
  • A 13% advantage executing and defining field programs
  • A 12% advantage in managing leads and lead pipelines

Forrester Research “The Forrester Wave: Lead-To-Revenue Management Platform Vendors” (Q1 2014)

78% of successful marketers say marketing automation systems are most responsible for improving revenue contribution. – The Lenskold Group 2013 Lead-Generation Marketing Effectiveness Study, (2013)

benefits of marketing automation The Ultimate Marketing Automation statistics overview

68% of Best-in-Class companies are using lead scoring, compared to just 28% of Laggard firms. – Aberdeen Group“State of Marketing Automation 2014: Processes that Produce” (2014)

Best-in-Class firms are more than 2X more likely to use lead nurturing with a MAP than Laggard firms (68% vs. 27%). – Aberdeen Group “State of Marketing Automation 2014: Processes that Produce” (2014)

Best-in-Class firms are more than 4X more likely to use database segmentation and targeting with a Marketing Automation Provider than Laggard firms. A difference of 78% vs. 23%. – Aberdeen Group “State of Marketing Automation 2014: Processes that Produce” (2014)

Best-in-Class companies reduced close cycle time by an average of 49%, compared with a 30% improvement by all other companies. – Aberdeen Group “State of Marketing Automation 2014: Processes that Produce” (2014)

88% of top-performing companies are effective in routing “hot” leads to Sales vs. 57% of All Others. – Aberdeen Group “State of Marketing Automation 2014: Processes that Produce” (2014)

B2C marketers who are using automation- including everything from birthday emails to cart abandonment programs – have seen conversion rates as high as 50%. – eMarketer “Email Marketing Benchmarks” (2013)

Best-in-Class companies saw a 36% conversion rate from marketing response (raw lead) to marketing-qualified lead (MQL) vs. 18% for All Others. – Aberdeen Group “State of Marketing Automation 2014: Processes that Produce” (2014)

Companies that use marketing automation are 3 times more likely to track and attribute their content-marketing efforts to multiple touchpoints than companies without automation (36% vs 11%). – The Lenskold Group “2013 Lead Generation Marketing Effectiveness Study” (2013)

4. Barriers to adoption and effectiveness of Marketing Automation

The lack of expertise and know-how (55,6 %), as well as lack of human resources (48,1 %) are most common reasons why companies are not using marketing automation. – Liana “The Benefits and Challenges of Marketing Automation” (2017)

not yet started marketing automation The Ultimate Marketing Automation statistics overview

The most significant barrier to marketing automation success is the lack of an effective strategy (52%) . – Ascend2“Marketing Automation Trends Survey” (2016).

The most significant barriers to marketing automation success are

  • Lack of an effective strategy (52%)
  • Complexity of the system (42%)
  • Inadequate contact data quality (38%)
  • Lack of employee skills (32%)
  • Lack of relevant content (31%)
  • Marketing and sales alignment (30%)
  • Budget constraints (27%)

Ascend2 “Marketing Automation Trends Survey” (2016).

marketing automation barriers The Ultimate Marketing Automation statistics overview
Main barriers to adoption of Marketing automation are: 1) No Need 2) No budget 3) No management approval. – ResearchCorp “Demand Generation Adoption Survey” (2014)

Technology integration complexity is the most challenging obstacle to success, 50% of companies indicate. The result is that only 25% of companies have extensively integrated their disparate marketing technology systems. Nearly as many (22%) have not integrated their marketing technologies at all. – Ascend2 “Marketing Technology Strategy” (August 2015)

ascend2 technology integration 2015 The Ultimate Marketing Automation statistics overview

The biggest problem areas when using Marketing Automation for less than 2 years are: Pipeline Reporting, Measuring marketing campaign effectiveness and increasing sales effectiveness – HeinzMarketing and Ontarget“Marketing Automation Effectiveness and Performance Survey” (2014)

The most challenging obstacles to success are lack of quality content (40%), budget constraints (38%) and the lack of an effective marketing automation strategy (38%). – Marketo & Ascend2 “Marketing Automation Strategies for Sustaining Success” (2015)

A lack of mature marketing practices / processes is the #1 reason for not implementing a marketing automation platform. Indicated by 45% not currently using a MAP. – Aberdeen Group “State of Marketing Automation 2014: Processes that Produce” (2014)

implementation marketing automation difficult The Ultimate Marketing Automation statistics overview

61% agree that the implementation process of Marketing Automation was difficult – B2Bmarketing.net and Circle Research “Benchmarking Report Marketing automation” (2015)

54% of marketers that hadn’t implement Marketing Automation, said it was part of their plan, but they have other elements in need of more immediate attention. 21% said that the cost structures where Prohibitive. – Redeye and TFM&A Insights “The Marketing Automation Report 2014” (2014)

13% of the marketers said a Lack of technical proficiency in their team was stopping them from adopting Marketing Automation. A lack of understanding of benefits is holding back 12% – Redeye and TFM&A Insights “The Marketing Automation Report 2014” (2014)

57% of respondents admit their marketing infrastructure is separated by channel, not wel-integrated, or lacking entirely. – Forrester Research & Oracle “Why You Need To Be A Modern Marketer” (2014)

Only 14% have standardized, fully integrated cross-channel marketing automation platforms, with 42% of retailers standing out as more advanced than other verticals using this type of solution. – Forrester Research & Oracle“Why You Need To Be A Modern Marketer” (2014)

66% marketers reported allocating less than 10% of their budget to Marketing Automation. – Regalix “The State of Marketing Automation” (2014)

54% marketers who have not yet implemented Marketing Automation cite lack of budgets as a major obstacle preventing implementation. – Regalix “The State of Marketing Automation” (2014)

5. Top Reasons for purchasing Marketing Automation

With 64%, Ease of implementation is the No. 1 criterion for choosing a marketing automation platform, followed by Technical support (42%) and cross-platform integration (41%). – Adestra “State of Marketing Automation Benchmarks for Success” (2017)

marketing automation software selection criteria The Ultimate Marketing Automation statistics overview

Only 23% say clients and recommendations factor into the evaluation for choosing a marketing automation platform. – Adestra “State of Marketing Automation Benchmarks for Success” (2017)

peppers cost of ownership The Ultimate Marketing Automation statistics overview
B2B marketing managers say the most important criteria for marketing automation software are (1) price, (2) product integration (e.g., CRM, social, web, mobile), and (3) ease of use. – Pepper Global “Marketing Automation Trends Report 2014” (2013)

86% marketers consider ‘ease of use’ as the most important criterion when evaluating automation tools. – Regalix“The State of Marketing Automation” (2014)

Analytics and reporting (52%), Campaign management (46%) and Lead nurturing (46%) are considered the most useful Marketing Automation features. Followed by lead nurturing (46%), email marketing (42%), Integration capabilities (40%), Lead scoring (32%) and list segmentation (26%) – Ascend2 “Marketing Automation Trends Survey” (2016).

useful metric marketing automation The Ultimate Marketing Automation statistics overview

Lead nurturing (57%), Analytics and reporting (52%) and List segmentation (39%) are considered the most valuable Marketing Automation features. – Marketo & Ascend2 “Marketing Automation Strategies for Sustaining Success” (2015)

marketing automation strategy important features The Ultimate Marketing Automation statistics overview

CMOs at top-performing companies say that the most important reason for implementing marketing automation is to increase revenue (79%) and get higher quality leads (76%). – Gleanster “Q3 2013 Gleanster Marketing Automation Benchmark” (2013)

b2b marketing challenges The Ultimate Marketing Automation statistics overview

In B2B Access to customer data (95%), Marketing alignment with sales (90%), fragmented marketing systems (83%) and limitations with current technologies (80%) are the 4 top challenges for reaching current marketing objectives. ACT-ON and Gleanster Research “Rethinking the Role of Marketing “ (2015)

17% of marketers described marketing automation software as “extremely important” for Demand Generation Success, 24% as “very important”. – Software Advice and Research Now “Demand Generation Benchmark” (2014)

The most important criteria for a marketing automation system for CMOs are ease-of-use (92%) and the ability to tie marketing performance to sales (72%). – Gleanster “Q3 2013 Gleanster Marketing Automation Benchmark” (2013)

6. Use of Marketing Automation

The top four features of a Marketing Automation used are email marketing (89%), lead nurturing (84%), integrations such as CRM, mobile, social etc for accumulating customer intelligence across channels (80%), and cross-channel campaign management (82%). – Regalix “The State of Marketing Automation” (2014)

59% of companies do not fully use the technology they have available. Those companies that don’t have all the marketing technology tools they need are much more likely to fully use what they have (33%), than those that do have all the tools they need (9%). – Ascend2 “Marketing Technology Strategy” (August 2015)

Only 3% of 186,500 businesses surveyed used one of the four most common marketing automation systems- Eloqua, Marketo, HubSpot or Pardot. – Mintigo “State of the Marketing Technology Industry” (2014)

predictive analytics The Ultimate Marketing Automation statistics overview

Only 14.4% of respondents are currently using predictive analytics, but 34.9% are considering adding it in the near future. – Heinz, Reachforce and research partners “The State of Pipeline Marketing Report” (2016)

89% of respondents who have deployed marketing automation have integrated it with a CRM system. – ResearchCorp “Demand Generation Adoption Survey” (2014)

90% of marketers agreed that integrated marketing technology could boost their key capabilities, yet only 4% marketers reported having a completely integrated marketing stack – Signal “Cross-Channel Marketing and Technology Survey. Overcoming Barriers to Cross-Channel Success: Optimizing the Marketing Technology Stack” (2014)

51% of marketing execs say their marketing technologies and data are only loosely integrated or not at all.Signal“Cross-Channel Marketing and Technology Survey. Overcoming Barriers to Cross-Channel Success: Optimizing the Marketing Technology Stack” (2014)

24% of companies has managed to integrate their core tools to the point it satisfies the majority of their integration needs. – Signal “Cross-Channel Marketing and Technology Survey. Overcoming Barriers to Cross-Channel Success: Optimizing the Marketing Technology Stack” (2014)

Almost 1 in 3 marketing execs reports feeling stuck or impeded by their technology infrastructures. – Signal“Cross-Channel Marketing and Technology Survey. Overcoming Barriers to Cross-Channel Success: Optimizing the Marketing Technology Stack” (2014)

65% of marketing executives plan to spend more money on marketing technology in the coming year, including 28% who plan to increase spending by more than 25%. – Conductor 182 Marketing Executives Reveal Their 2015 Success Tactics (2015)

56.1% of mid-sized companies use marketing automation in conjunction with CRM.Beagle Research Group“2013 Marketing Automation Study: Data and Analytics: Marketing’s Next Frontier” (June 2013)

75% of very successful users outsource all or part of their marketing automation strategy planning to benefit from specialized expertise. – Marketo & Ascend2 “Marketing Automation Strategies for Sustaining Success” (2015)

Only 22% of mid-sized companies use analytics to manage their marketing campaigns. – Beagle Research Group“2013 Marketing Automation Study: Data and Analytics: Marketing’s Next Frontier” (June 2013)

confidence up to date best practice marketing automation The Ultimate Marketing Automation statistics overview
22% of marketers report that they aren’t confident they can stay up to date with Marketing automation best practices, 79% was confident they could. – B2Bmarketing.net and Circle Research “Benchmarking Report Marketing automation” (2015)

67% of respondents report having both marketing automation software and CRM software in their marketing stack. – Heinz, Reachforce and research partners “The State of Pipeline Marketing Report” (2016)

The adoption of marketing automation coupled with CRM integration has grown remarkably 5 years ago 7.9% of respondents had an integrated CRM and demand generation solution and only 1 in 4 (27%) had some level of integration. – ResearchCorp “Demand Generation Adoption Survey” (2014)

Of companies that use cloud-based marketing automation tools, 50% of them use multiple marketing automation systems. – VentureBeat “Marketing Automation index update” (2014)

B2B marketers target an average of 4 different audiences with separate content marketing strategies – Content Marketing Institute & MarketingProfs “2015 B2B Content Marketing Benchmarks, Budgets and Trends” (Sept 2014)

Marketing attribution plays a huge role in measuring marketing performance, particularly to down-funnel metrics such as revenue. 75% of respondents said that they had an attribution model in place, 38.8% of respondents reported using single touch attribution models, while 25.4% are using multi-touch models. – Heinz, Reachforce and research partners “The State of Pipeline Marketing Report” (2016)

Only 22.4% of respondents believe that they are using the right attribution model. Despite that, only 30.2% plan to change their attribution model in the near future. – Heinz, Reachforce and research partners “The State of Pipeline Marketing Report” (2016)

The best performing capabilities are CRM Integration, Outbound marketing campaign integration and Extending length of customer lifecycle for companies using MA more than 2 years. – HeinzMarketing and Ontarget“Marketing Automation Effectiveness and Performance Survey” (2014)

The best performing capabilities for MA over 2 years in relation to importance are Lead Segmentation, Lead Nurturing Campaigns and Generating New Prospects. – HeinzMarketing and Ontarget “Marketing Automation Effectiveness and Performance Survey” (2014)

45% of companies are taking advantage of lead nurturing capabilities in their Marketing Automation Platform, including just 68% of Best-in-Class companies. – Aberdeen Group “State of Marketing Automation 2014: Processes that Produce” (2014)

B2B top Performers are 20% more likely to currently use Marketing Automation technology than the average performers. – ACT-ON and Gleanster Research “Rethinking the Role of Marketing” (2015)

85% of B2B marketers using marketing automation platforms feel that they’re not using them to their full potential. SiriusDecisions “Increasing Adoption of Marketing Automation Platforms” (2014)

About the Author: Jordie van Rijn

 The Ultimate Marketing Automation statistics overview

Jordie van Rijn is an independent email marketing consultant. Next to helping companies improve their email marketing results he gives email marketing training and is a writer and speaker in the field of online marketing.

share save 171 16 The Ultimate Marketing Automation statistics overview
Posted in MA | Tagged | Comments Off on The Ultimate Marketing Automation statistics overview

Why You must Use Kanaka

1536 thumb Why You must Use Kanaka

Kanaka is an automation platform that can completely transform the way you do marketing & sales, if you know how to use its full capabilities.Score and segment leads based on demographic and behavioral data

– Turn browsers into buyers using a triggered campaign that automatically emails leads when they download high-value content or visit a key page, such as pricing

-Email, tweet or sync leads to your CRM when they reach a pre-defined lead score threshold or visit a specific URL on your website

-Empower their sales team with the information they need to have a productive conversation with leads sourced/touched by marketing

Using marketing automation can significantly reduce the manpower you need to follow up with prospects one-on-one, while still having a personalized touch. With the real-time intelligence that Kanaka gathers on your website visitors and email subscribers, you can fine-tune your communications based on your prospects’ needs, interests and readiness to buy. Your sales team can recapture the time they previously spent doing follow-ups and put it towards prospecting, discovery calls and closing sales instead. Kanaka is a tool that both your marketing and sales team will love.

Smarter Email Marketing

Traditional email marketing tactics, such as monthly newsletters and e-blasts speak to your contacts with a one-size-fits-all approach. At best, you had a couple of different segments like leads, newsletter subscribers and customers. It’s all about personalization nowadays and with Kanaka, you’ll be able to send your subscribers more engaging emails with autoresponders, dynamic content and drip campaigns.

Inbound Content Marketing

Nobody likes to be interrupted, especially when they’re busy. With Kanaka, you can implement an inbound marketing strategy that respects your contacts’ time and lets them engage with your product education content, at their own pace. Set up landing pages that “gate” high-value content such as eBooks, whitepapers and webinars behind progressive profiling forms that gather information about your lead as they download multiple pieces of content on your website.

Kanaka CRM and Account Based Marketing

Especially for B2B companies with high-dollar value sales, it can take months or years before a lead turns into a customer. Through a tracking cookie, Kanaka gives you insight into what topics your prospect researched about your product and how frequently on your website. With new Account Based Marketing (ABM) functionality introduced in Kanaka, you can easily visualize influencers and decision makers at your target accounts, within the context of a Company.

Kanaka has a built-in CRM, but you can also sync leads over to a third-party CRM such as Salesforce, HubSpot or SugarCRM for follow up once the lead has reached a certain lead score threshold, filled in a form or clicked on a link in an email. As a sales manager, you’ll save time with automated “new lead notifications” that will assign leads to a team member as soon as an opportunity arises. Another new feature introduced in Kanaka are Gmail and Outlook plugins for sending tracked emails on a one-to-one basis.

share save 171 16 Why You must Use Kanaka
Posted in MA | Comments Off on Why You must Use Kanaka